Cell Ranger DNA1.1, printed on 04/05/2025
| Analysis software for the 10x Genomics single cell DNA product is no longer supported. Raw data processing pipelines and visualization tools are available for download and can be used for analyzing legacy data from 10x Genomics kits in accordance with our end user licensing agreement without support. |
We discuss here in detail how we calculated the sensitivity and positive predictive value (PPV) of copy number calls made using cellranger-dna cnv pipeline on the 5k MKN-45 Gastric Cancer Cell Line dataset. We chose this cell line because it shows a relatively low level of cell-to-cell variation in copy number and has a broad spectrum of copy number events ranging from less than 100 kb to more than 10 mb. The low heterogeneity allowed us to evaluate the single cell copy number calls using bulk data.
In order to validate the copy number calling performance, we created a second Illumina PCR-free TruSeq library from bulk genomic DNA extracted from the same cell line sequenced to a depth of 700 million reads (2x150 paired-end reads). We called copy number variants on the bulk TruSeq data using Ginkgo (see the publication for more details on the method) with bin size of 5kb. The resulting CNV calls can be found here. We treat the bulk CNV calls as true events in the cell line and calculate the sensitivity and PPV for event detection amongst the single cells and groups of cells.
We divided the GRCh37 reference genome into 20 kb bins and selected bins where at least 70% of the 35-mers in the bin were unique in the genome. We restricted our comparison of CNV calls to these "confident regions". We consider an event detected if a one or more CNV calls match the copy number of the event and together overlap the event region by at least 50%. A CNV call is a false positive if the corresponding the genomic region in the ground truth has a different copy number. The sensitivity is defined as the fraction of total events detected, and the PPV is the fraction of all CNV calls that are true. Additionally, since the algorithms detect copy number changes, a segment with copy number 2 between two segments with copy numbers not equal to 2 is considered an event.
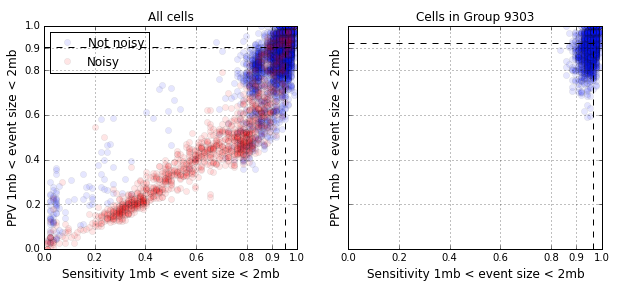
The figure below shows the single cell CNV detection performance. The vast majority of points in the left panel are in the upper right quadrant with high sensitivity and PPV. The points in red are cells that are labeled as noisy, a majority of which, are due to cells undergoing DNA replication. When we restrict our attention to the dominant homogeneous cluster in the population, Group 9303, the cells cluster in the upper right quadrant. The median sensitivity and PPV is greater than 90% for events in the size range of 1 - 2 megabases (84 such events).
The quality of CNV detection improves as we aggregate together similar cells. The CNV detection performance for 2,408 cells aggregated together in Group 9303 is as follows:
| Event size | Number of events | Sensitivity | PPV |
|---|---|---|---|
| 100kb < size < 200kb | 108 | 91 | 95 |
| 200kb < size < 500kb | 109 | 95 | 98 |
| 500kb < size < 1mb | 58 | 97 | 100 |
| 1mb < size < 2mb | 84 | 98 | 98 |
| 2mb < size < 10mb | 196 | 100 | 100 |
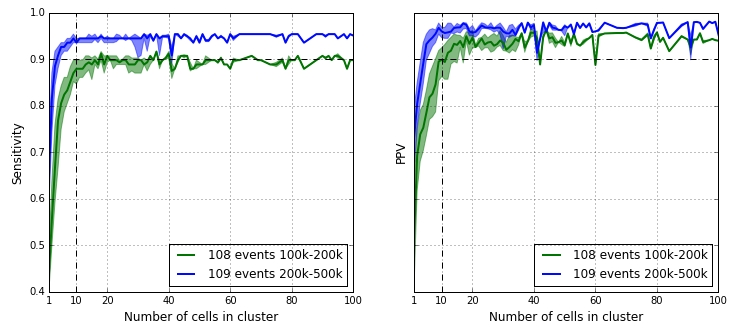
We computed the sensitivity and PPV for each sub cluster of the majority cluster as defined by the tree and the results are in the figure below. The sensitivity and PPV statistics for the majority cluster are already reached at around the 10 cell mark. This demonstrates high quality CNV event detection is possible in a 1 % sub population in a 1000-cell experiment.