Cell Ranger2.0, printed on 04/02/2025
With the CD8+ cytotoxic T cell dataset loaded, let's take a quick tour of the Loupe V(D)J Browser user interface.
The Loupe V(D)J Browser interface consists of two main panels. On the left is the content panel. This is where most of the interaction and data display occurs. When you first load the dataset, the content panel displays a summary chart which shows the top 100 clonotypes, sorted by abundance. Above the chart are controls to change the type of chart, a few chart-specific options, and an export button.
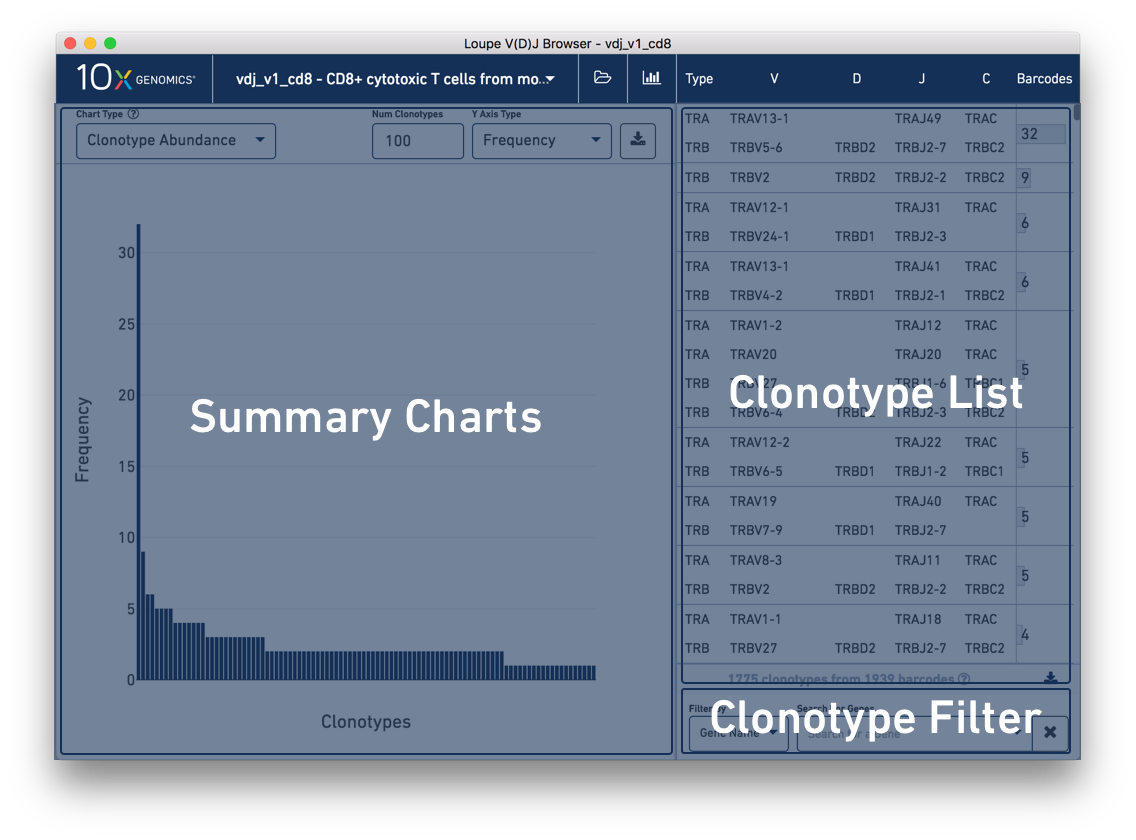
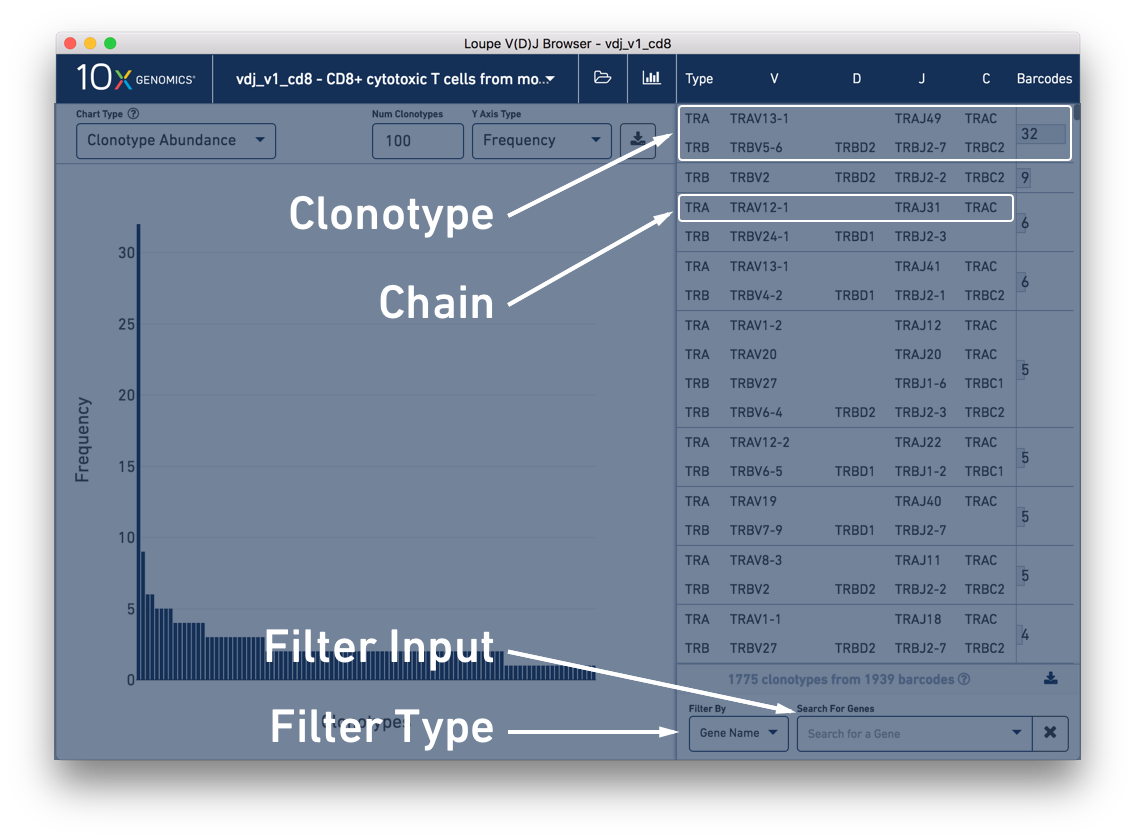
On the right is the clonotype list, which initially displays the list of all clonotypes in the loaded sample. Each clonotype contains one or more (typically two) receptor chains, one per line. As indicated at the top of the clonotype list, the first column indicates the chain's type, here TRA or TRB. (If the sample included B cells, we would see types IGH, IGK, and IGL.) The next four columns, from left to right, display the V gene annotation, D gene annotation (if any), J gene annotation, and C gene annotation.
In the rightmost column is the clonotype barcode count which overlaps a bar to indicate that clonotype's relative frequency within the sample. You can hover over the bar to see the frequency of the clonotype as a percentage of total barcodes. The top clonotype in the tutorial sample should have 32 barcodes (1.6% of total).
Below the clonotype list are tools for filtering the clonotype list by gene, CDR3, and more. We'll explain how to use this in the next section, Filtering via the Clonotype List.
Between the clonotype list and the filter options is a gray bar indicating the current number of clonotypes in the list and the number of barcodes assigned to those clonotypes. These numbers are updated when clonotype filters are applied. To the right of this data is a download button, where you can export the current filtered or unfiltered clonotype list to a CSV as paired clonotypes or as single chains.
Above the content panel, you will see the name of the currently opened file and two icons. Clicking on the folder icon will give you options to return to the file selection screen, load additional V(D)J samples, or load matched 5′ gene expression data. We'll cover analysis of integrated V(D)J and gene expression data in a separate tutorial. Clicking on the bar chart button will return you to the summary chart screen.
One of the major visualizations Loupe V(D)J Browser offers is the chain view, which shows how contigs
assembled from each cell form a consensus V(D)J sequence of one chain of a clonotype.
You can enable chain view by clicking on any chain in the clonotype list at right. Click the alpha
chain on the top clonotype (TRAV13-1/TRAJ49/TRAC), and you should see something like this:
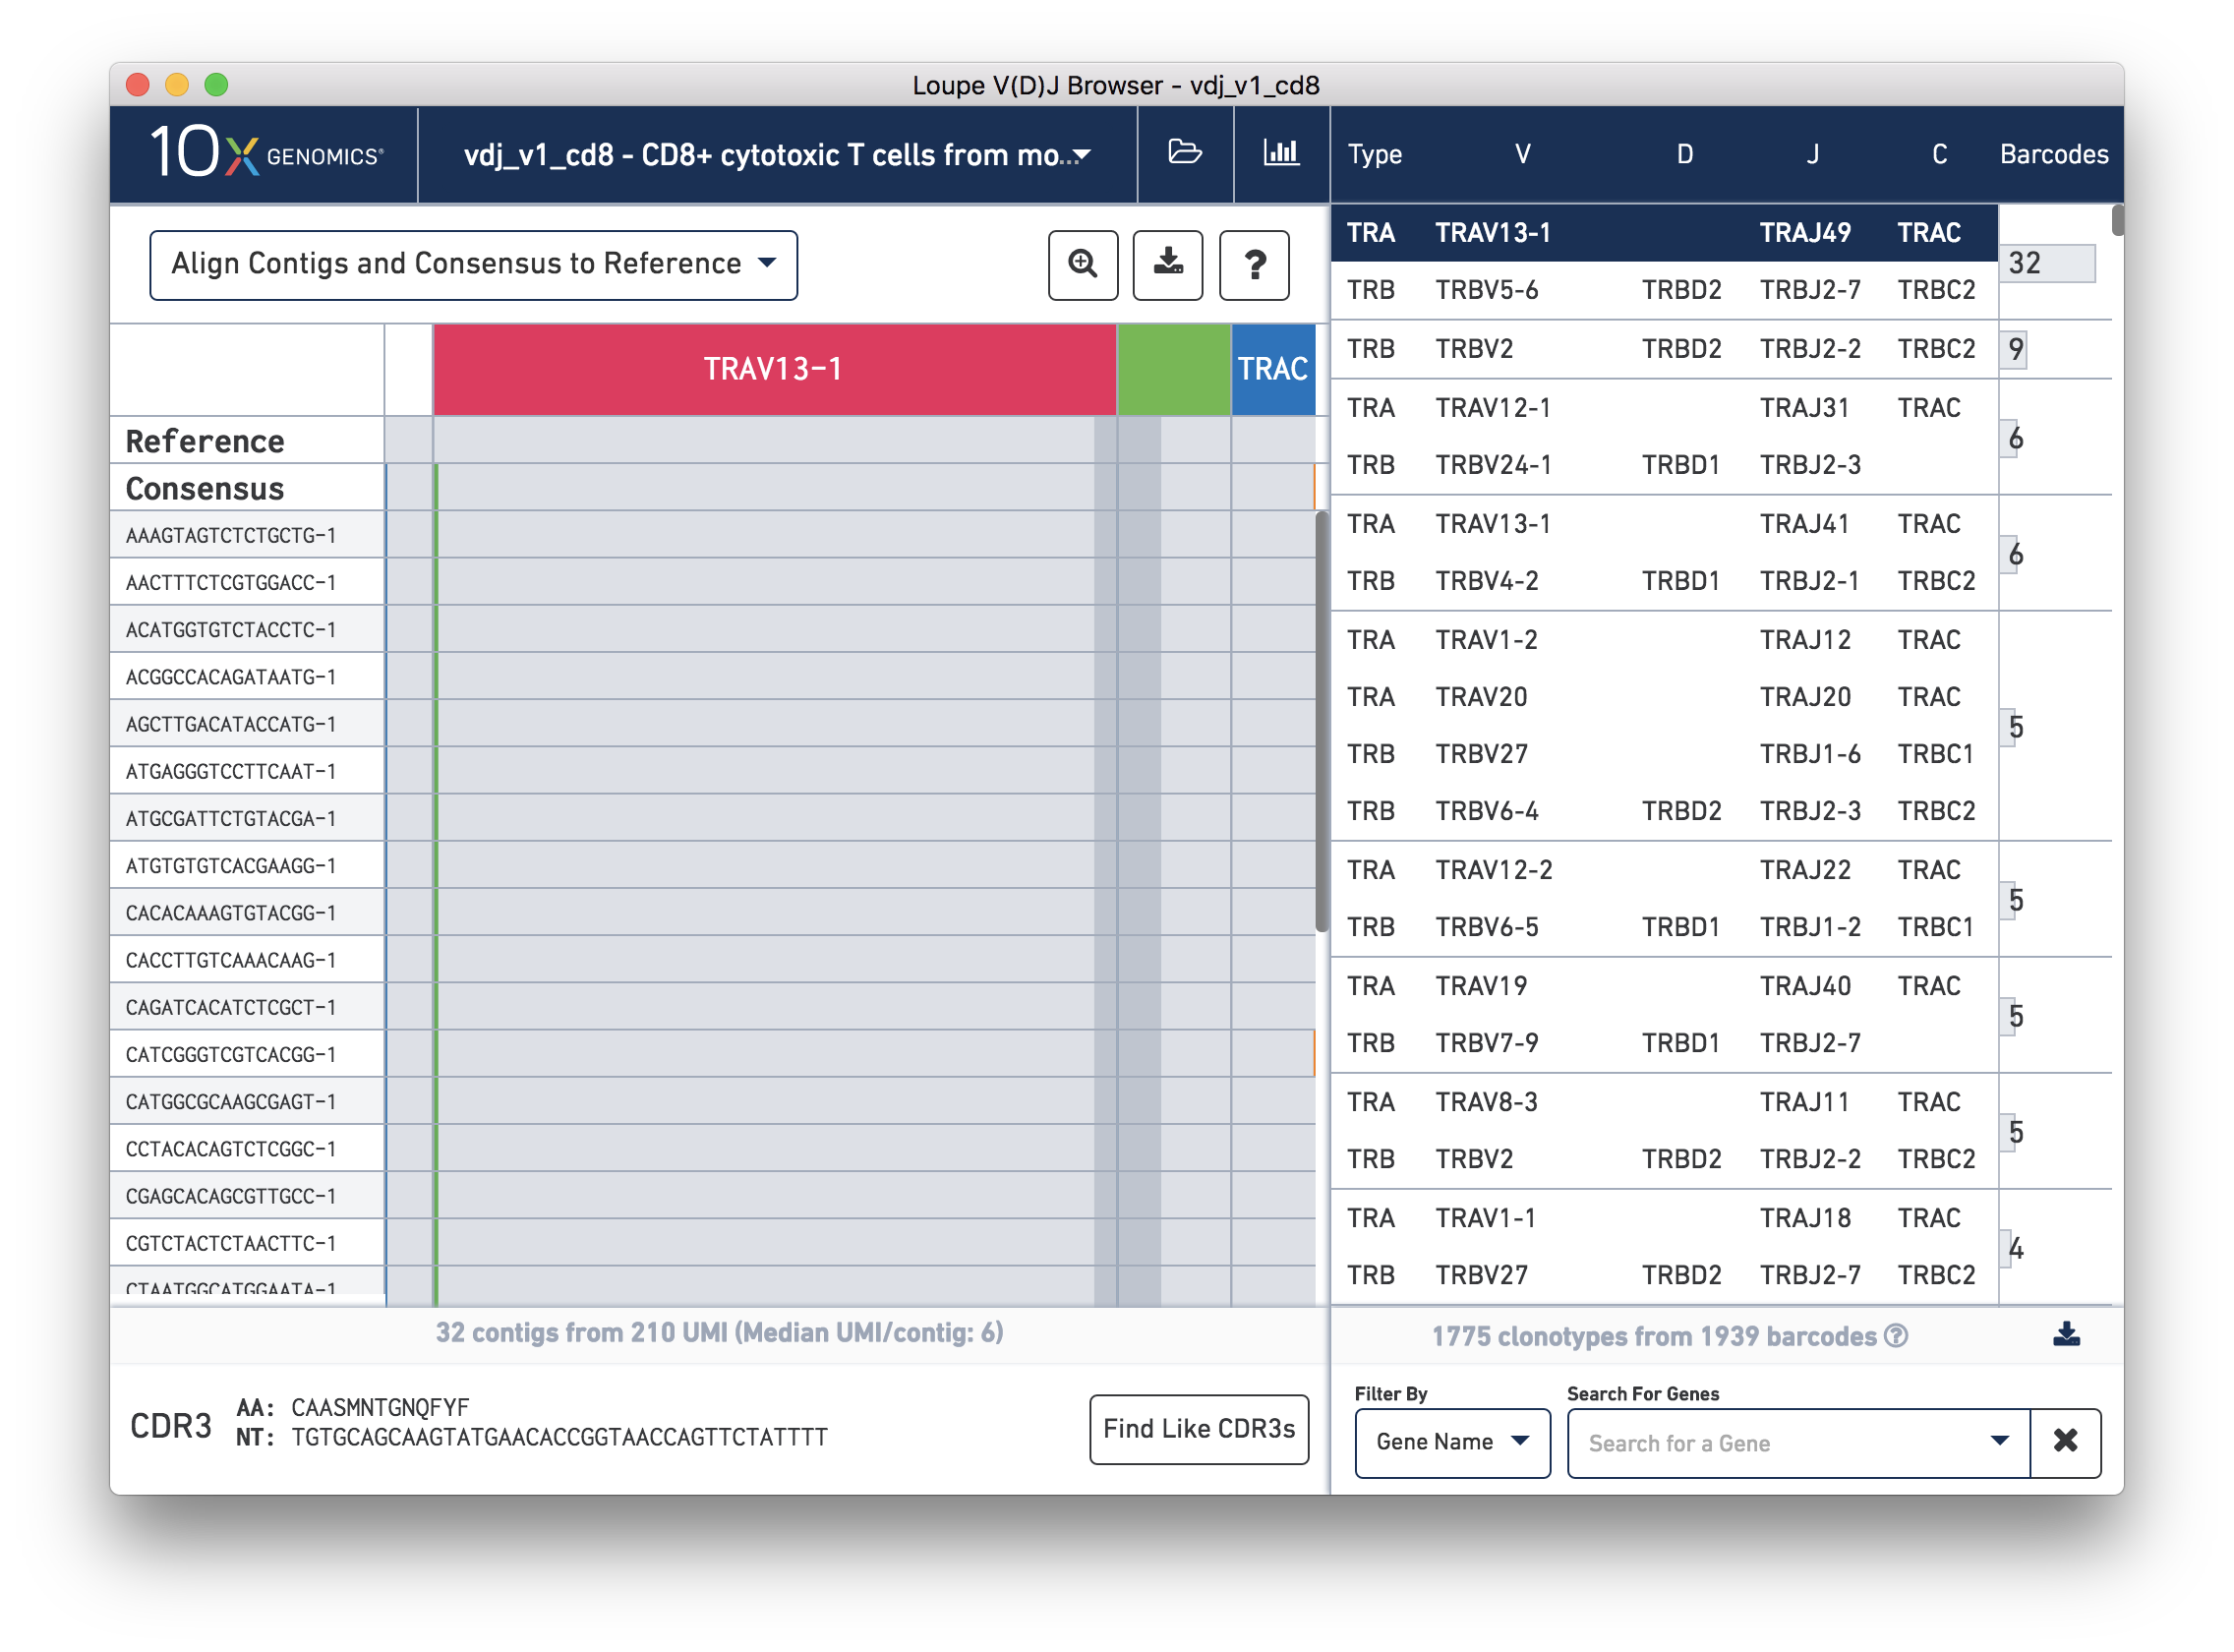
The content panel now shows a zoomed-out view of contig sequences and variants, aligned to the reference sequences for each gene. Through this view, you'll be able to verify the commonality of contigs within a clonotype, detect SNPs, and interrogate direct read support for a particular contig. We'll go into much more detail about this view in the Chain View and Read Support sections.
Let's go back to the summary charts by clicking the chart icon at the top of the window. From here we'll look into exploring the clonotypes in this sample at a high level.