Long Ranger2.0, printed on 04/02/2025
HAPLOTYPES view displays the haploid genotype information contained in any genomic region of a sample. Like a regular genome browser, it allows you to zoom and scroll over chromosomes and navigate through genes and their exons. Unlike a regular genome browser, it displays the genome as two haplotypes; SNPs, small insertions and deletions are mapped to each haplotype based on the phasing algorithm of Long Ranger
Clicking on HAPLOTYPES in the navigation bar directs you to the Haplotype browser. To go to a specific area of the genome, you can type a gene name, or a coordinate in the search box at the end of the navigation bar (Acceptable coordinates are discussed in Getting Started). Above HAPLOTYPE tracks, you will find coordinates of the region, as well as tools to zoom in and out of the region. In addition, you can zoom in to a specific gene by clicking on it.

On the top of the browser, you will see a miniature chromosome with the centromere marked by a dark rectangle and chromosome bands marked by light grey rectangles. The green triangle indicates the location currently in zoom, giving you a big picture view of your region of interest with respect to the rest of the chromosome.
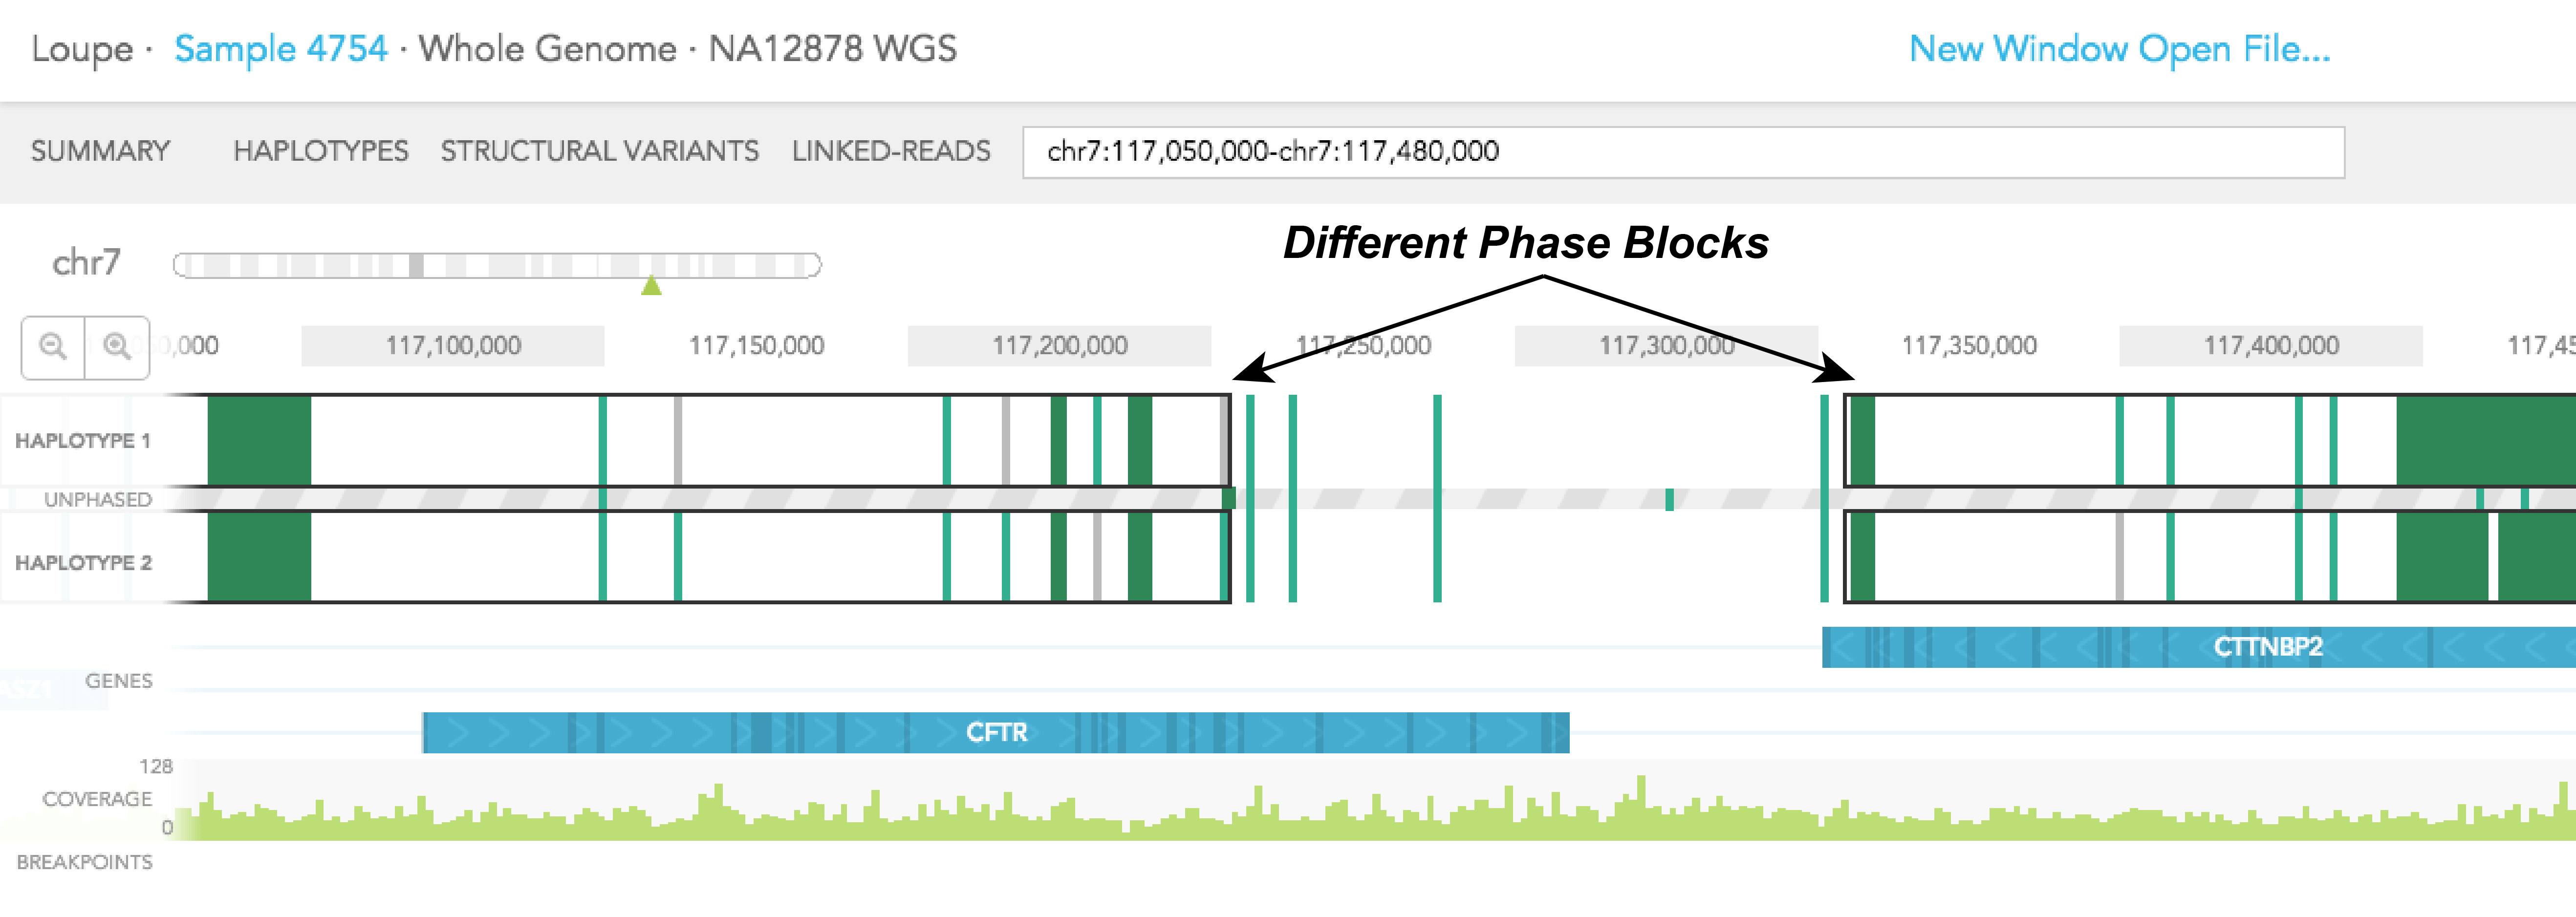
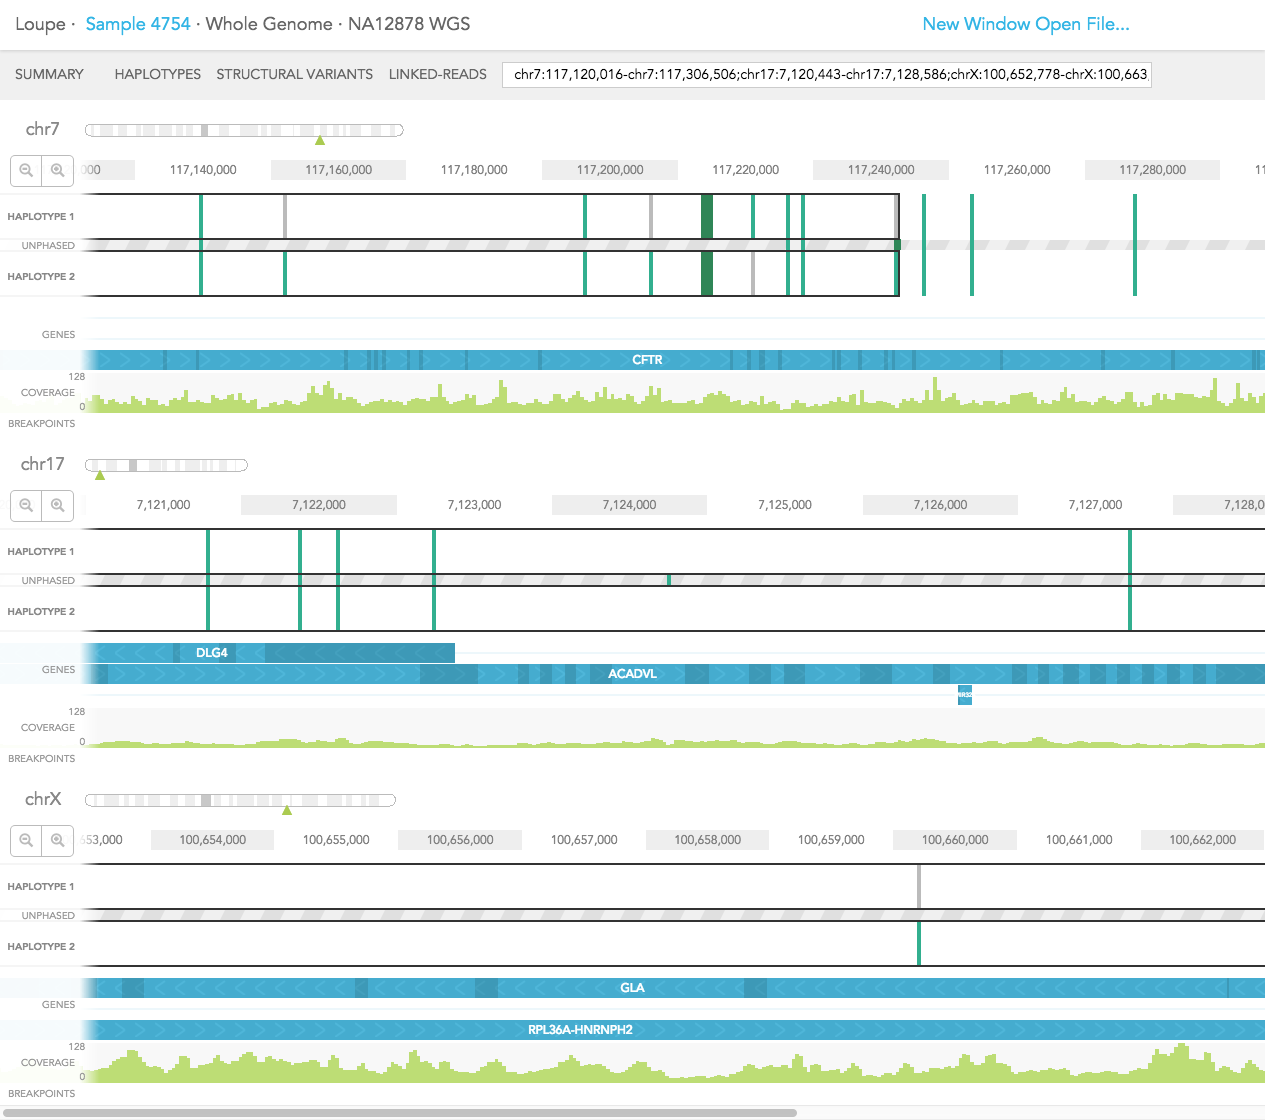
HAPLOTYPE 1 and HAPLOTYPE 2 are displayed as two separate tracks for the region of interest. Phased portions of the region are enclosed in black rectangular boxes. These boxes demarcate phased blocks, a contiguous phased region of the chromosome as determined by Long Ranger. In the example of CFTR gene, most of the gene is phased, except the last 30% of the gene, which is not phased. For CTTNBP2, the entire gene is phased. It is important to note that since CFTR and CTTNBP2 are on 2 different phase blocks (separated by a region that is not phased), haplotype assignment to SNPs and indels in CFTR is not necessarily consistent with haplotype assignment in CTTNBP2. Haplotype assignment is only applicable to variants in the same phase block.
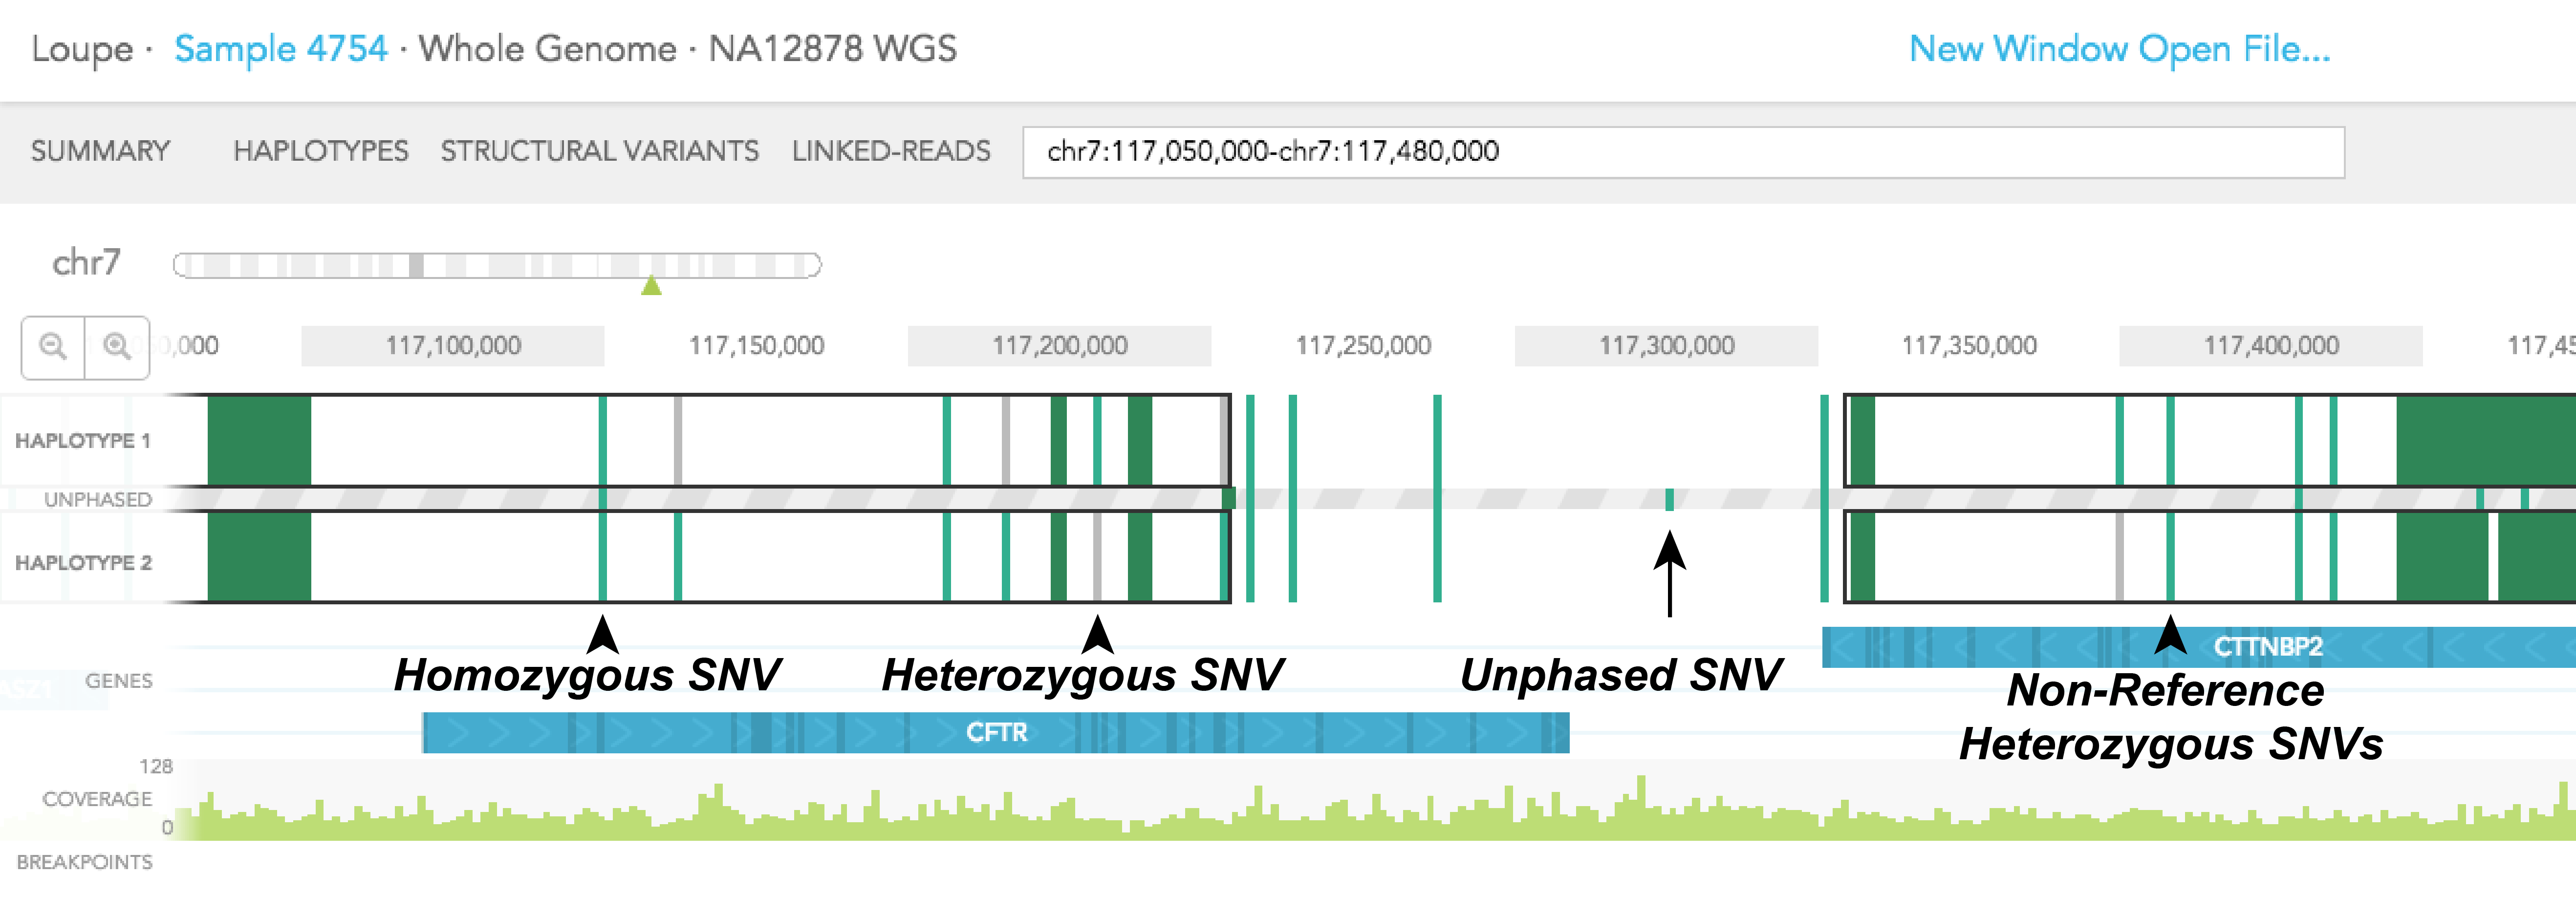
Colored vertical bars represent SNPs, small insertions and deletions, with grey representing the reference genotype, and green representing the alternative genotype. A homozygous SNP will have a vertical bar spanning the 2 haplotype tracks and the UNPHASED track since homozygous variants cannot be phased. Phased heterozygous SNPs are placed on the HAPLOTYPE tracks. Heterozygous SNPs are placed in the UNPHASED track sandwiched in between the 2 HAPLOTYPE tracks when they are not phased. Finally, if both phased SNPs are of alternative genotype, two green vertical bars will be displayed in the HAPLOTYPE 1 and HAPLOTYPE 2 tracks, one for each track.
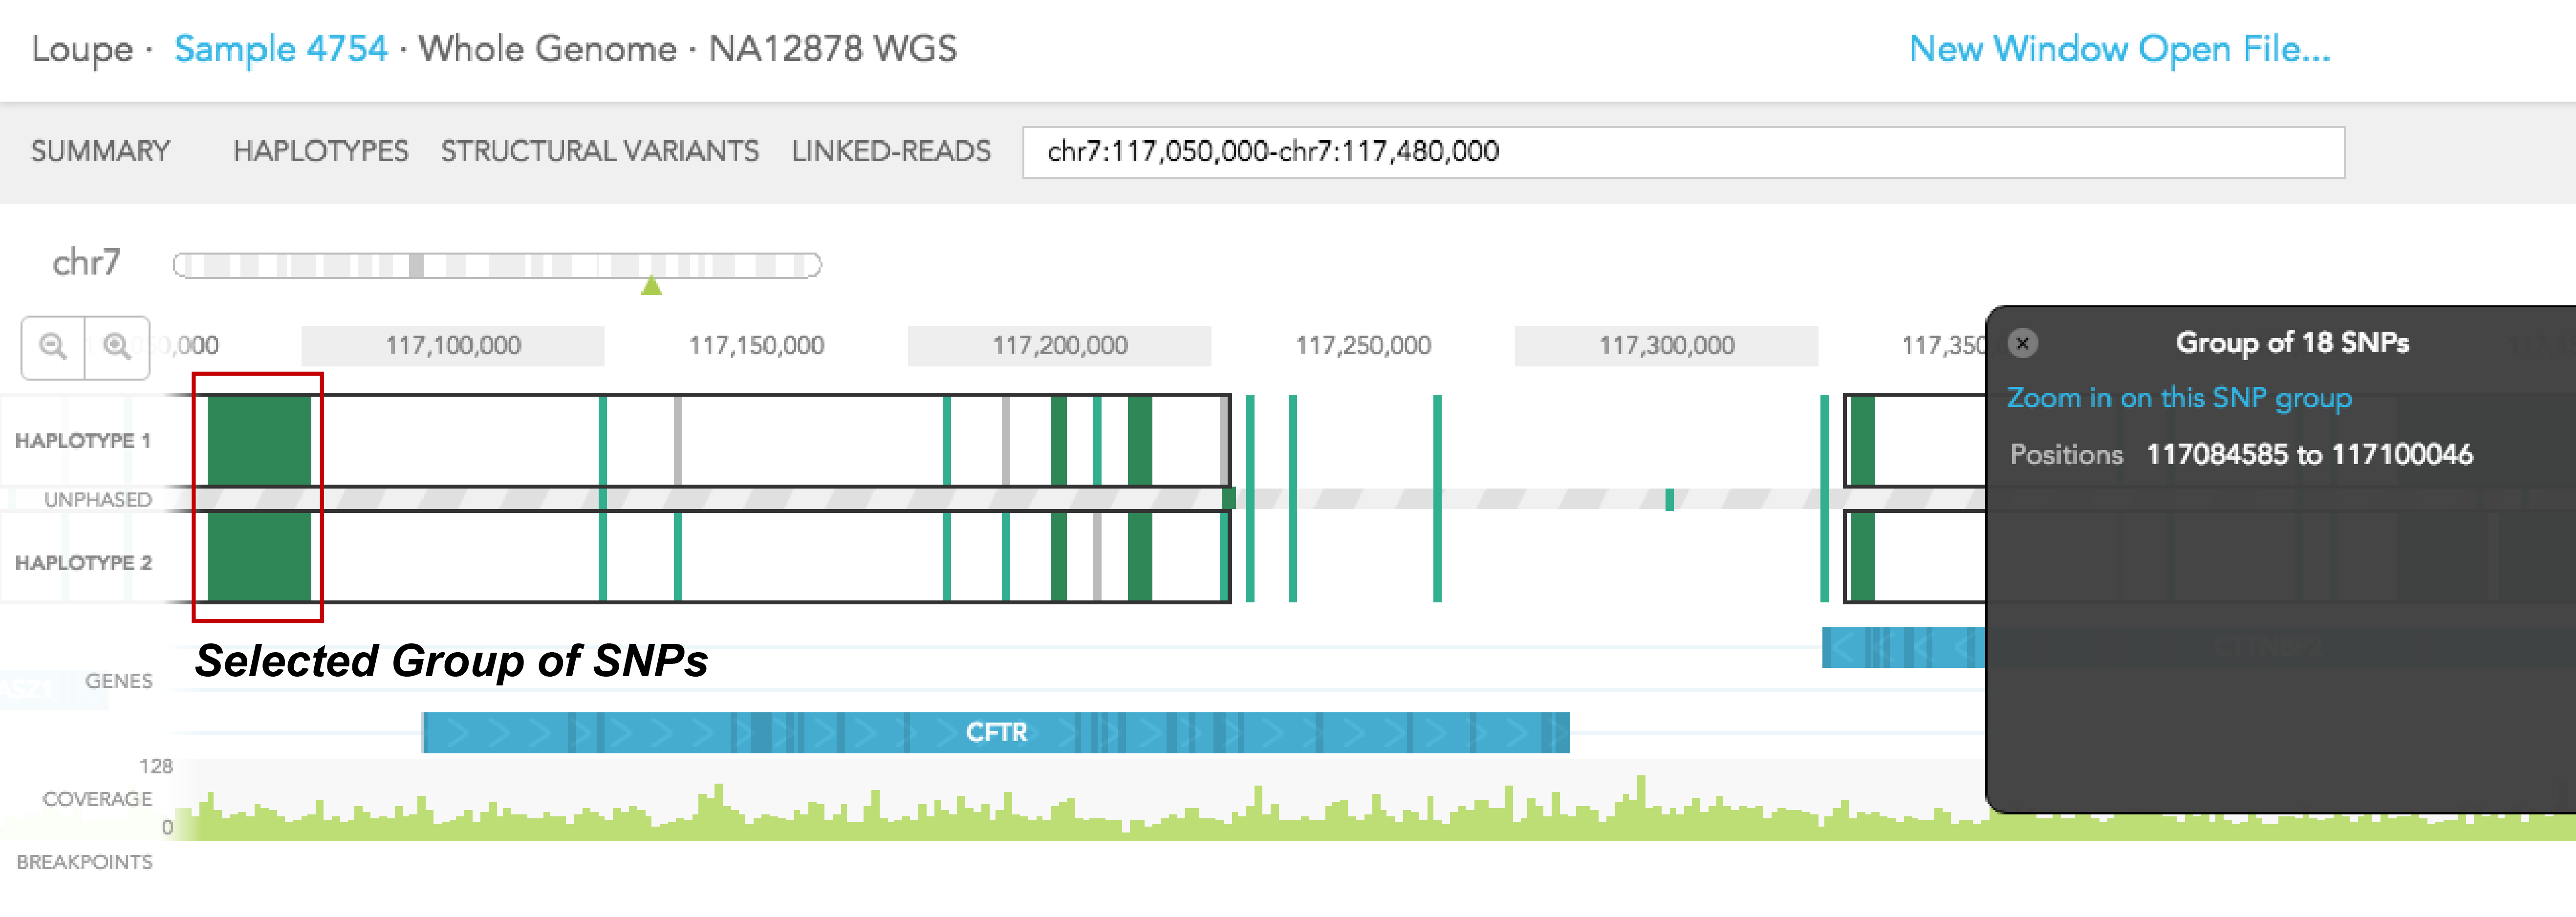
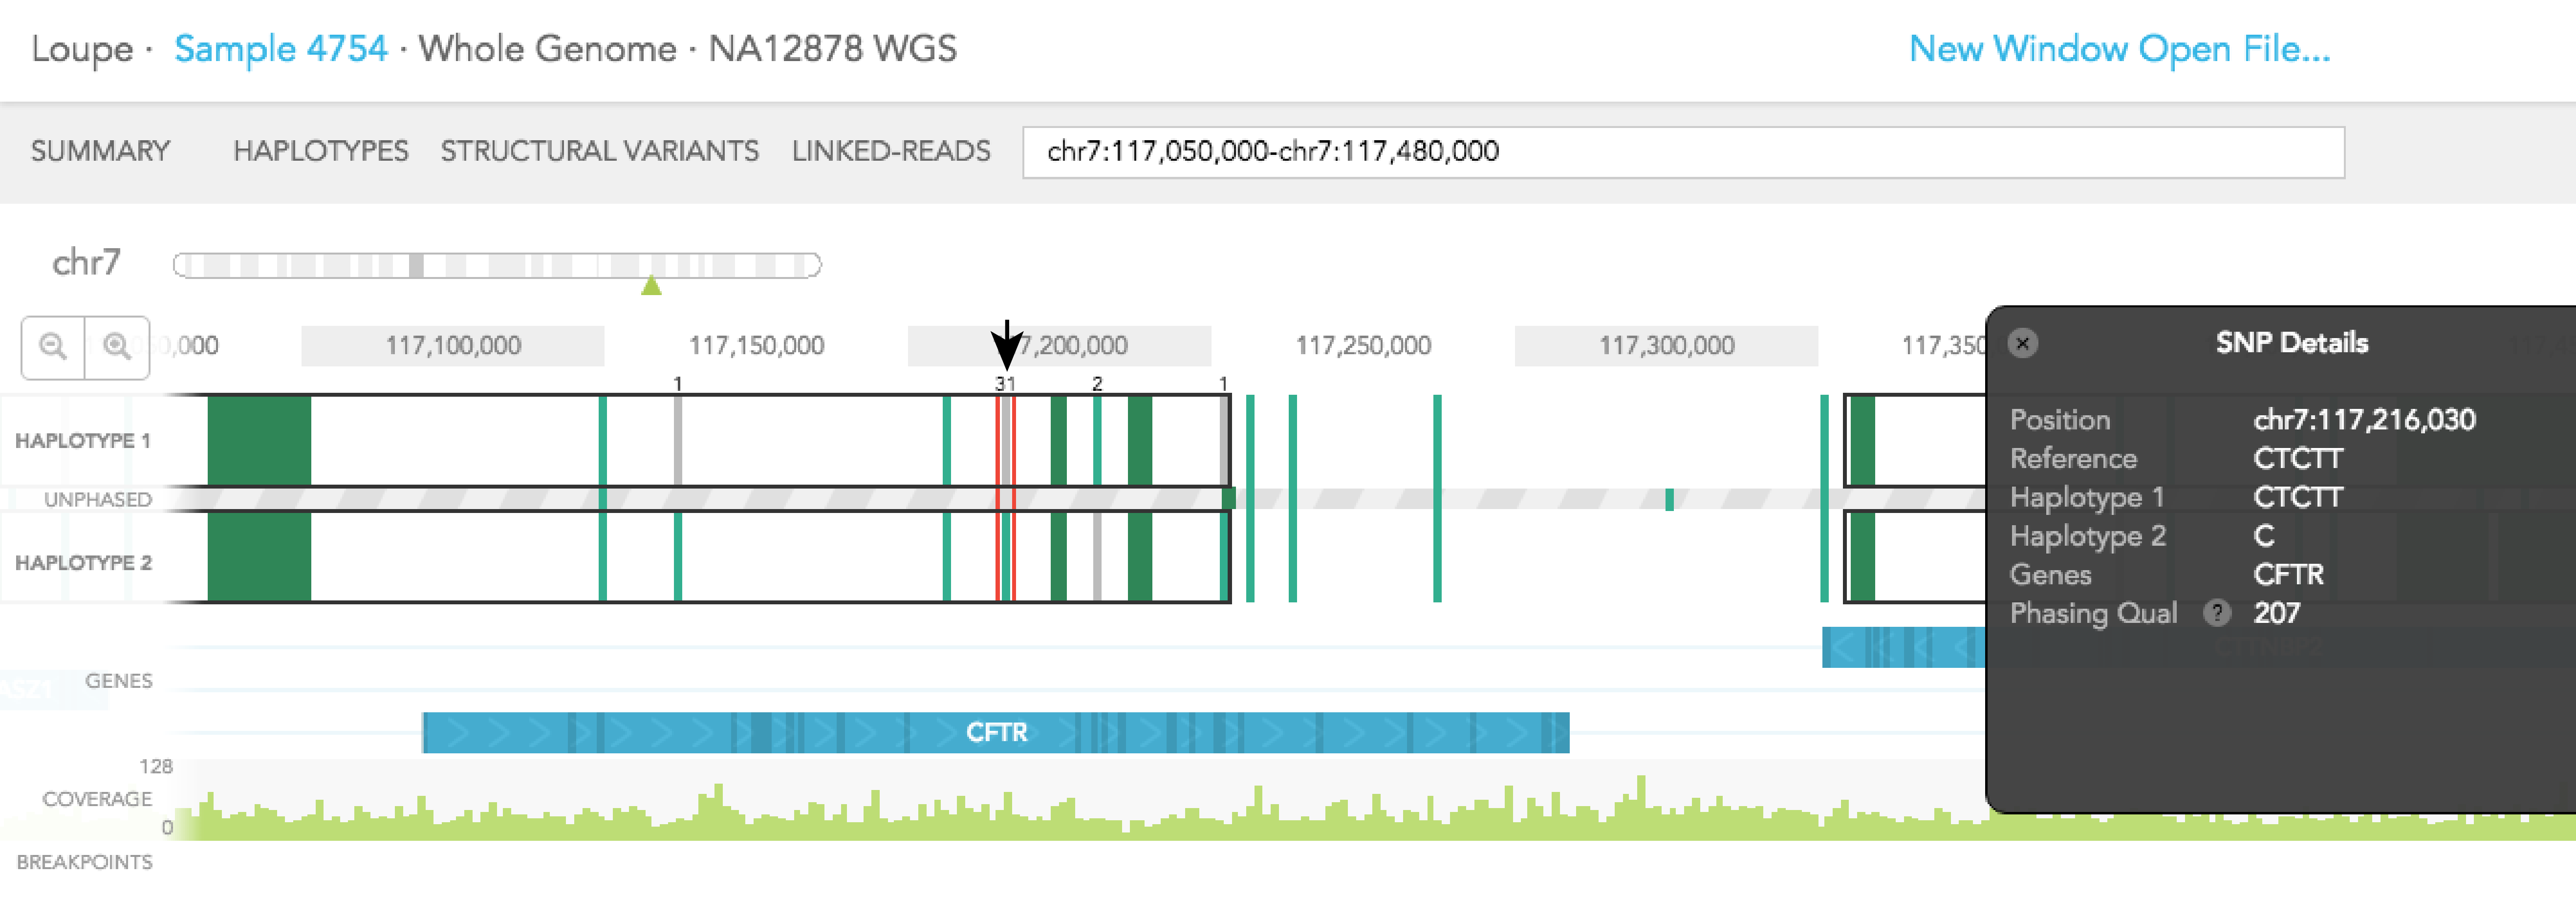
Dark green regions of the haplotype track represent areas with high SNP density. You can click on the region to zoom in to individual SNPs. A pop-up black box will appear on the right side of the browser, with a link allowing you to ''Zoom in on this SNP group.'' In general, this box provides additional information on the SNP, such as position, the reference genotype, observed genotypes of haplotype 1 and 2 in the sample, the gene where SNV is found (if associated with a gene), phasing quality, and allele counts of the 2 observed genotypes. The box can be dismissed by clicking on the X on the upper left corner of the box. The phasing quality is a Phred-like score used to quantify the phasing quality of an SNP.
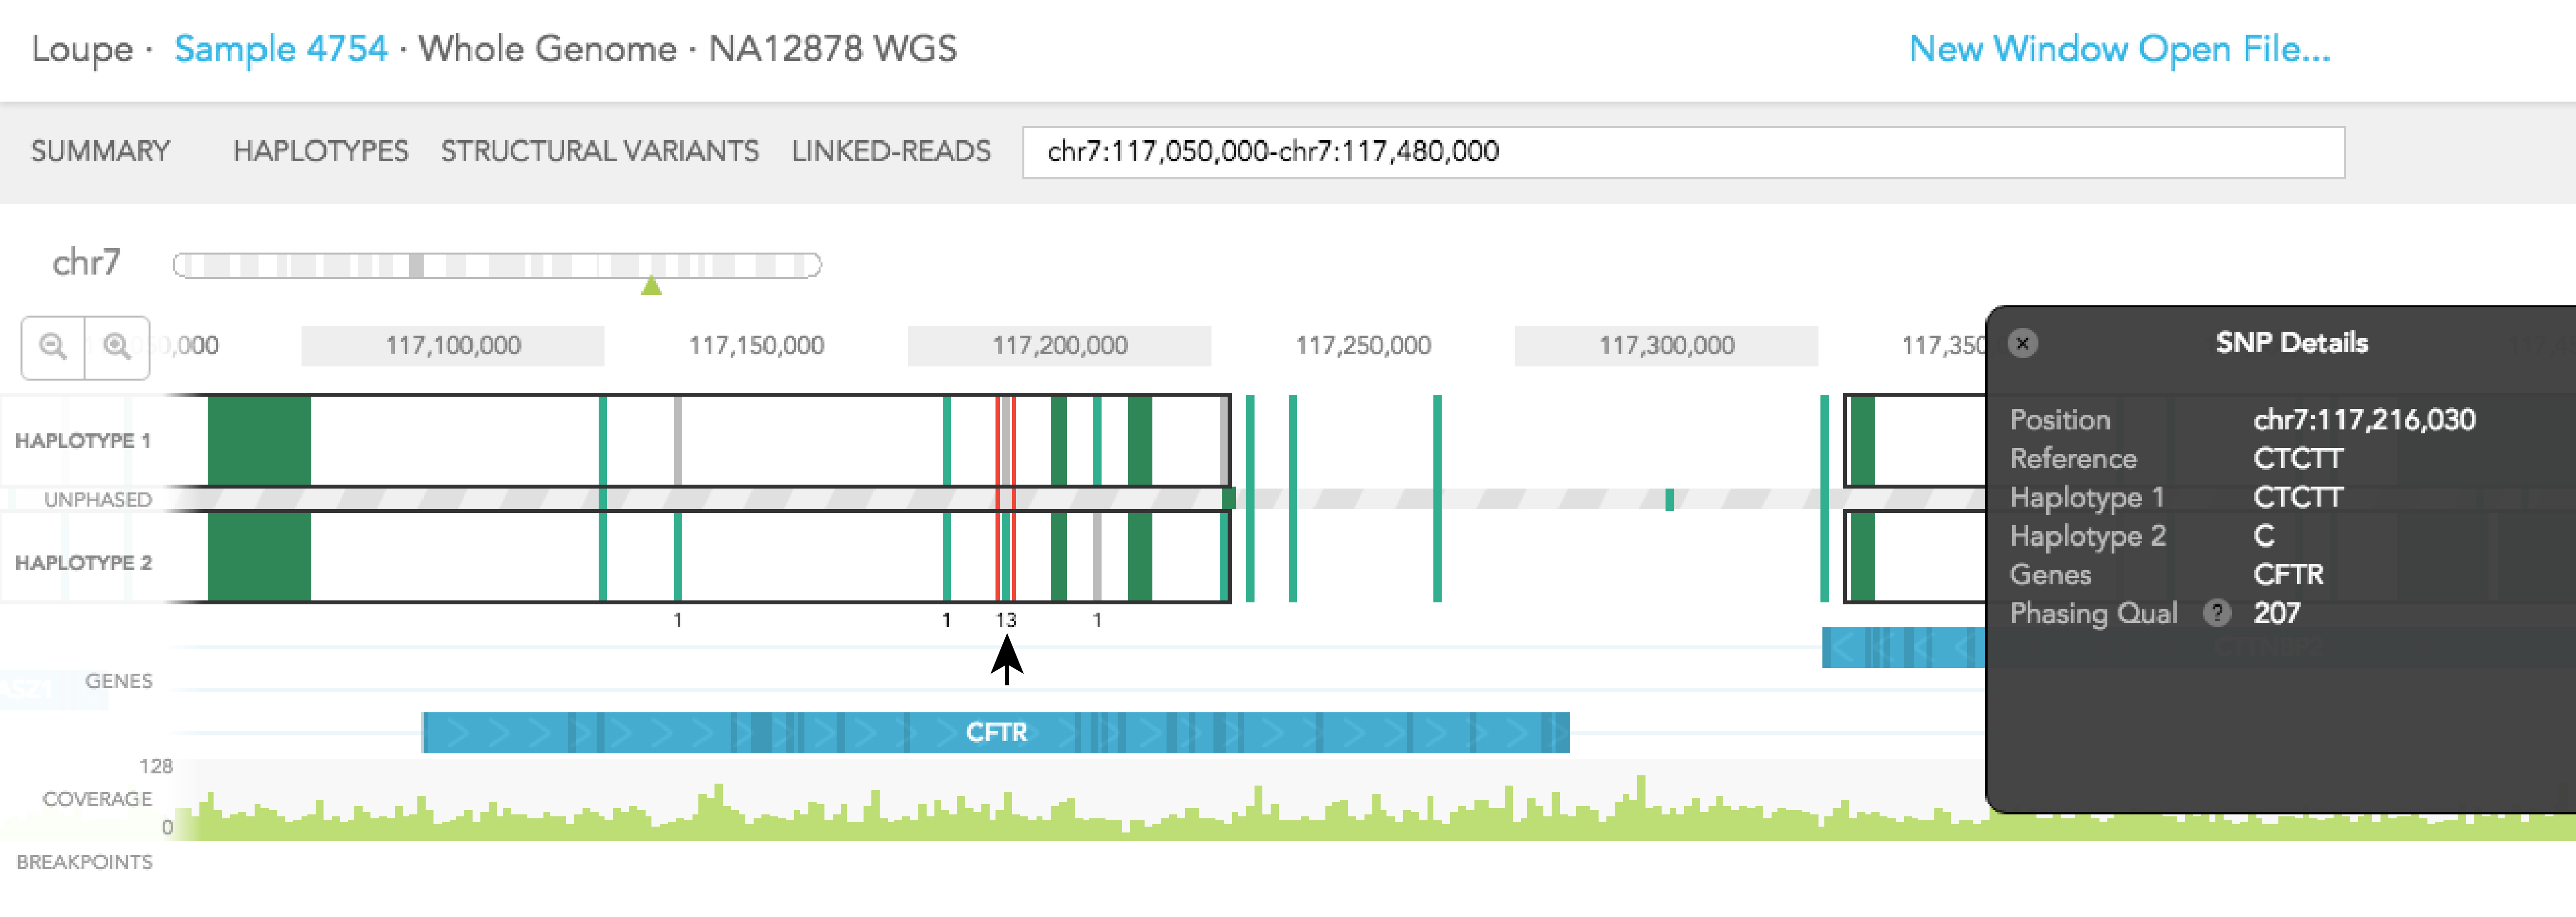
When you click on one of the alleles for a variant, a red rectangular box highlights that variant. The number displayed next to the highlighted variant represents the number of barcodes that are associated with the selected allele for that variant. You will notice numbers displayed on the top and/or bottom of adjacent variants. Each shows the number of barcodes that overlap between the selected allele and one of the two alleles of the adjacent variants. Numbers displayed in black agree with the phasing call of the variant, while numbers displayed in red disagree with the call. The greater barcode overlap there is between neighboring variants, the more confident the phasing of the variant is. As an example, for the reference call at Chr7: 117,216,030 you will see 31 on the top of HAPLOTYPE 1, indicating there are 31 barcodes associated with the reference allele at that position. If you select the variant SNV at the same position 13 barcodes support the phasing and the labeled neighboring SNVs change as seen in the images below.
The GENES track displays annotated reference genes. Multiple genes can be displayed using the search bar by entering the genes of interest. The direction of each gene is indicated with arrows and exons are highlighted with dark blue shades. Overlapping genes are shown on a maximum of three tracks in the GENES track but many genes may be displayed using the search bar.
Aligned reads are shown on the COVERAGE track. Each vertical green bar in the COVERAGE track shows the average coverage-per-base for the area of the genome under the bar. The height is scaled such that maximum height is four times the median coverage. If you click on the coverage graph, the mean reads per base pair and total number of reads will be displayed in the Coverage Details pop-up black box on the right.
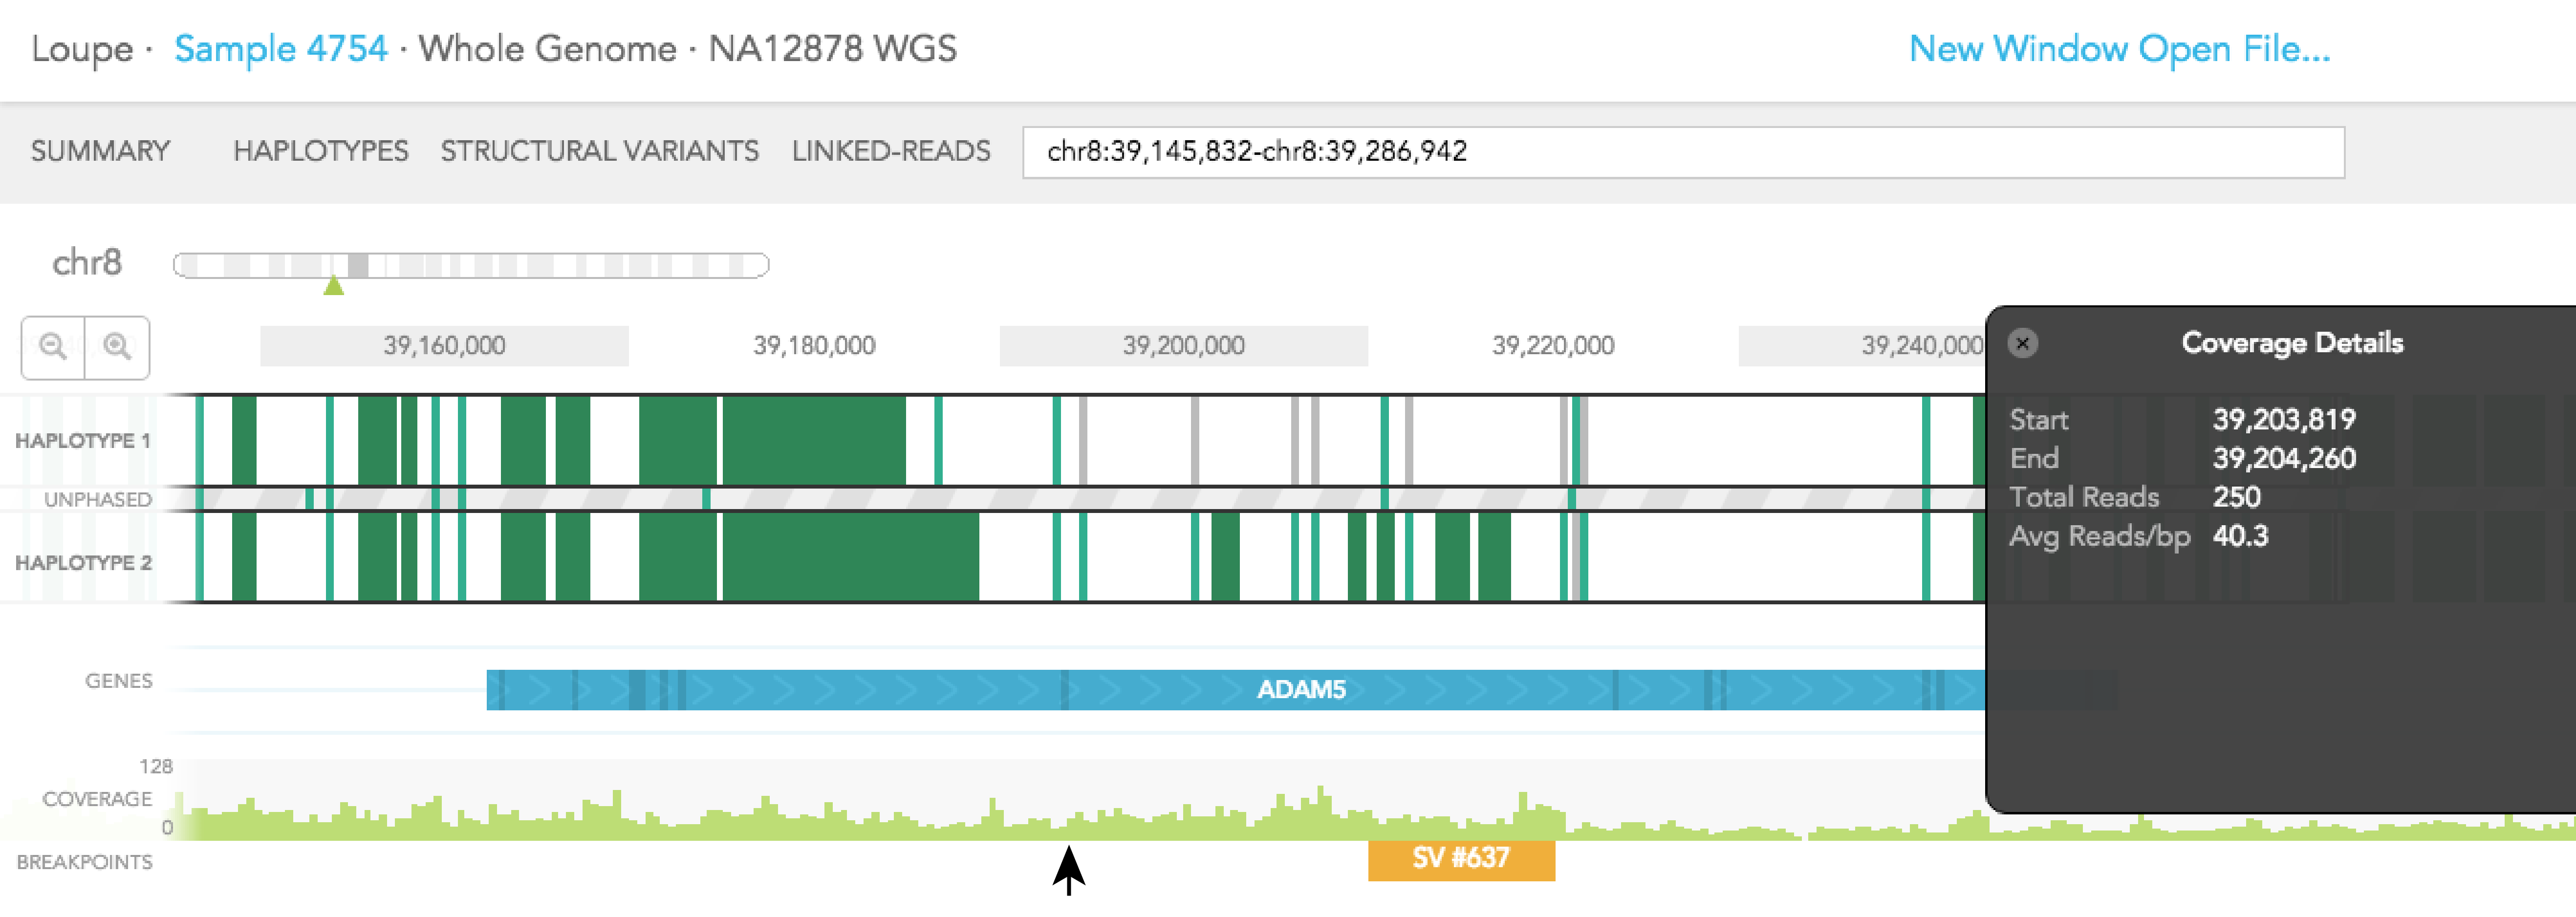
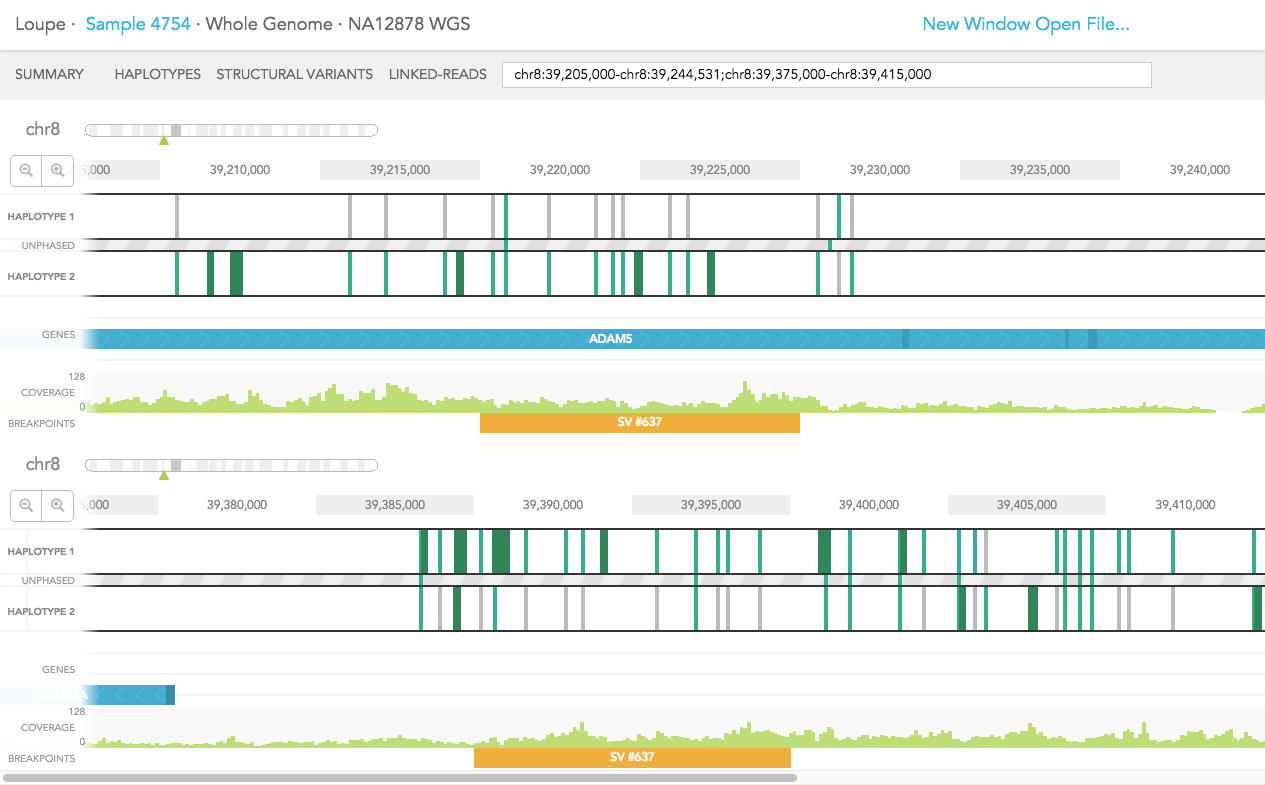
Structural variants including inter-chromosomal translocations, gene fusions, inversions and deletions are highlighted in the BREAKPOINTS track. Structural variants are arbitrarily numbered in this display. CALLS are indicated with orange and CANDIDATES are specified in grey. To display structural variant breakpoint pairs, click on the structural variant displayed for the gene, as shown below.
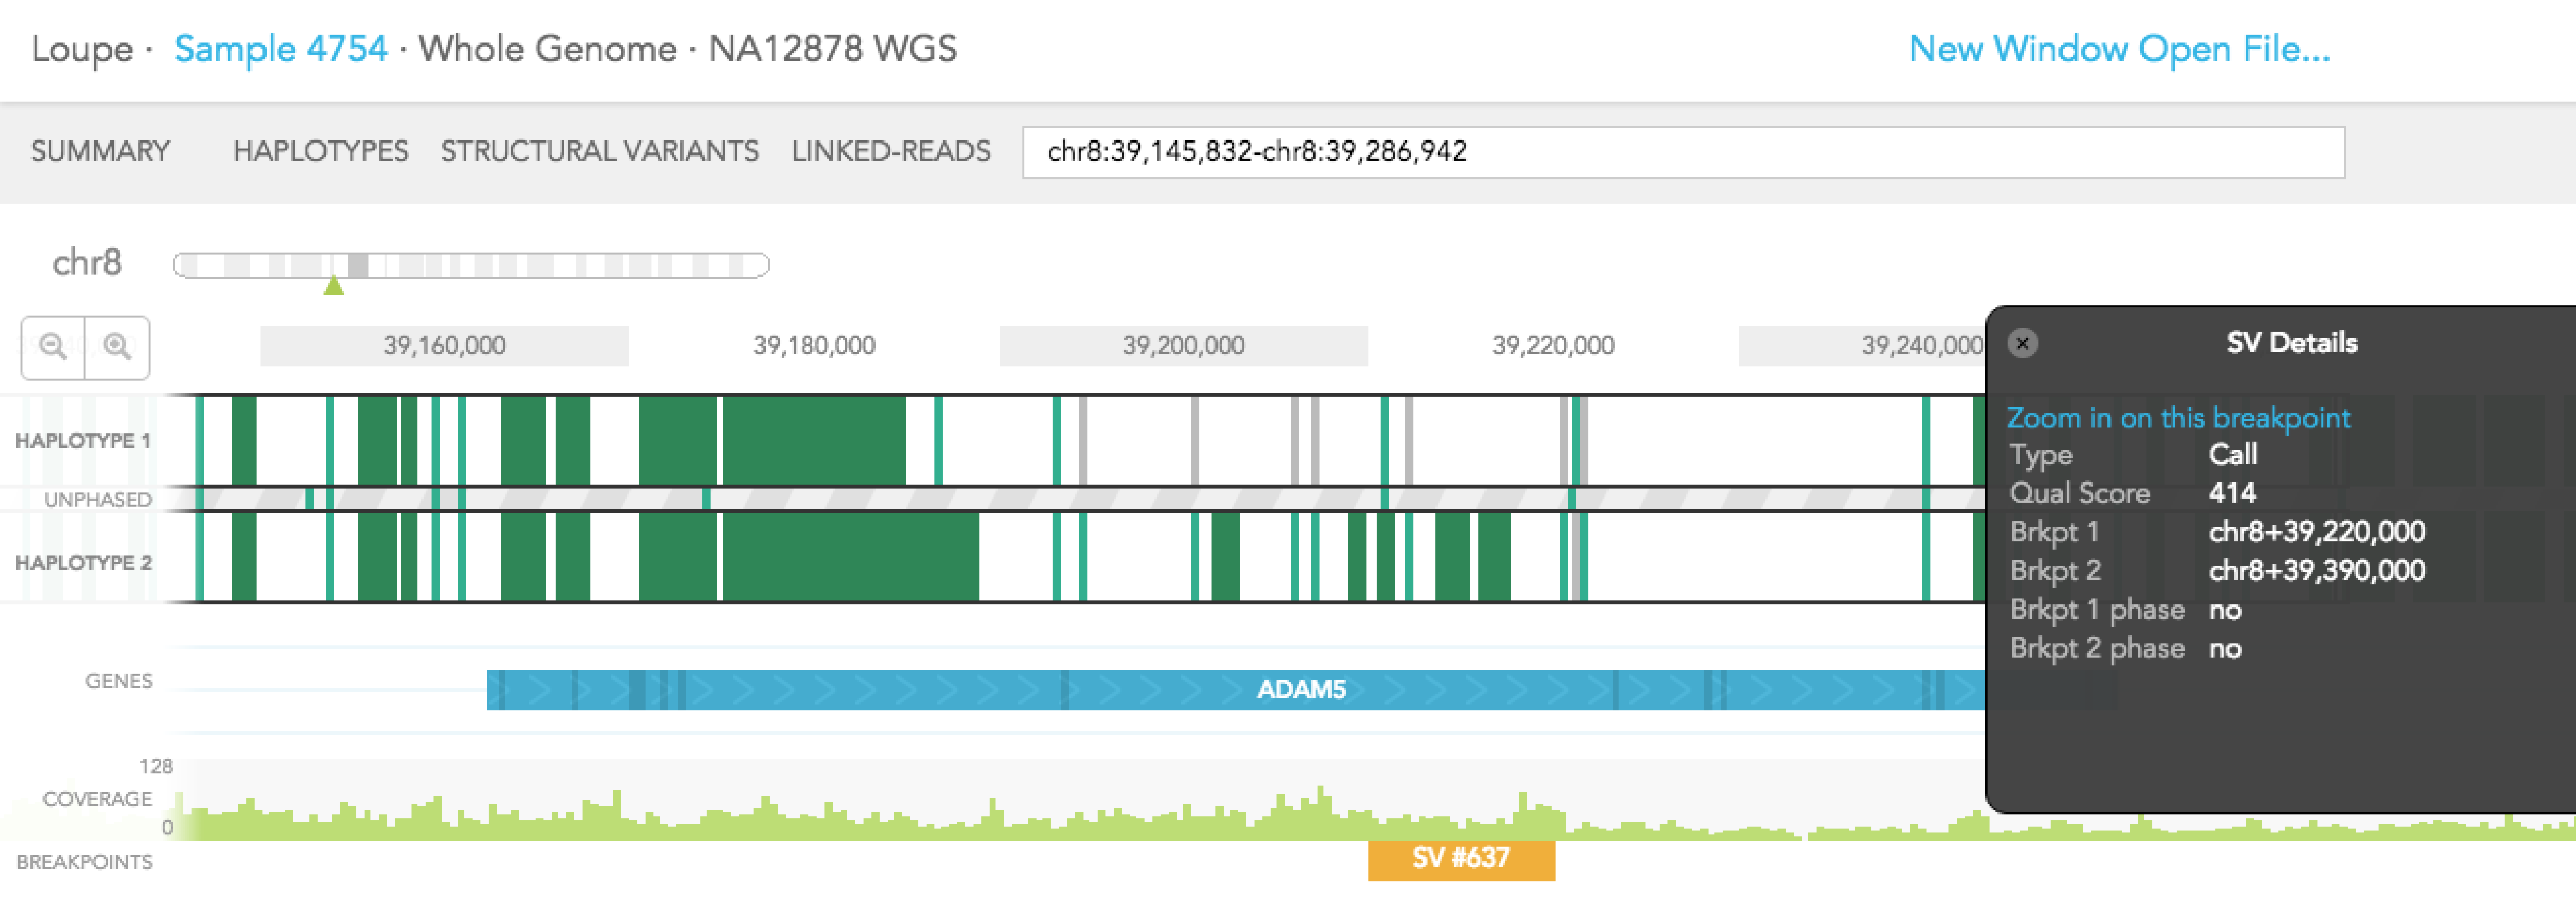
The structural variant is displayed in the details box. By selecting "Zoom in on this breakpoint" in the SV details box, you will bring up the other side of the breakpoint as an additional haplotype track, zoomed to the breakpoints, as shown below.