Supernova2.1, printed on 04/05/2025
| Analysis software for 10x Genomics linked read products is no longer supported. Raw data processing pipelines and visualization tools are available for download and can be used for analyzing legacy data from 10x Genomics kits in accordance with our end user licensing agreement without support. |
The power of a Chromium™ Genome dataset is highly dependent on molecule length. In general longer molecules are better. It is therefore important that Supernova accurately measure molecule lengths, both as feedback to users of Supernova and as an input to assembly algorithms. With this goal, Supernova 2.0 introduces a new method for estimating the distribution of molecule lengths in a Chromium Genome library. This page outlines the method, and is provided as deep background material. It is complicated and not needed unless you want to understand how the new molecule length calculation works. However some of the frequently asked questions at the end are of general interest.
Molecule lengths may be estimated from a Supernova assembly. Indeed a set of reads, all having the same barcode, positioned nearby on a scaffold, define a molecule, whose length may be estimated from the read positions. This apparently straightforward approach was used by Supernova before 2.0. However it is biased by the heuristics used to place reads on the assembly (especially in repeat regions). It is also very difficult to correctly model the length of molecules containing a tiny number of reads. Because these difficulties may be impossible to overcome directly, we set out to develop a new approach.
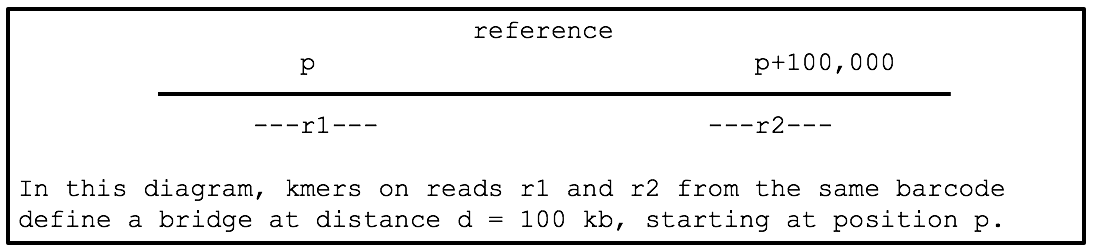
Suppose first that the true sequence of the genome is known. Consider a fixed
separation d. Consider a random pair of kmers on the genome separated by
exactly d bases. Across such random instances, the mean number of barcodes for
which the dataset contains both kmers [and which (‘condition m’) actually
originate from the same molecule] is called the bridging at distance d.
This metric is highly indicative of dataset power. However because of ambiguity regarding which molecule a repeat kmer lies on, it is not possible to compute the metric directly. Instead we restrict attention to kmers that occur exactly once in the genome sequence (after collapsing homologous chromosomes if the genome sequence is diploid) and we treat d as an approximate (± 5%) rather than exact separation; we do not test condition m because in nearly all cases it should be automatically true. This results in a computable definition of bridging that should closely mirror the theoretical definition. Bridging can be computed by using a genome assembly in place of a reference sequence for the genome, and in cases tested, yields nearly identical results. Bridging computations from typical Supernova assemblies are shown below:
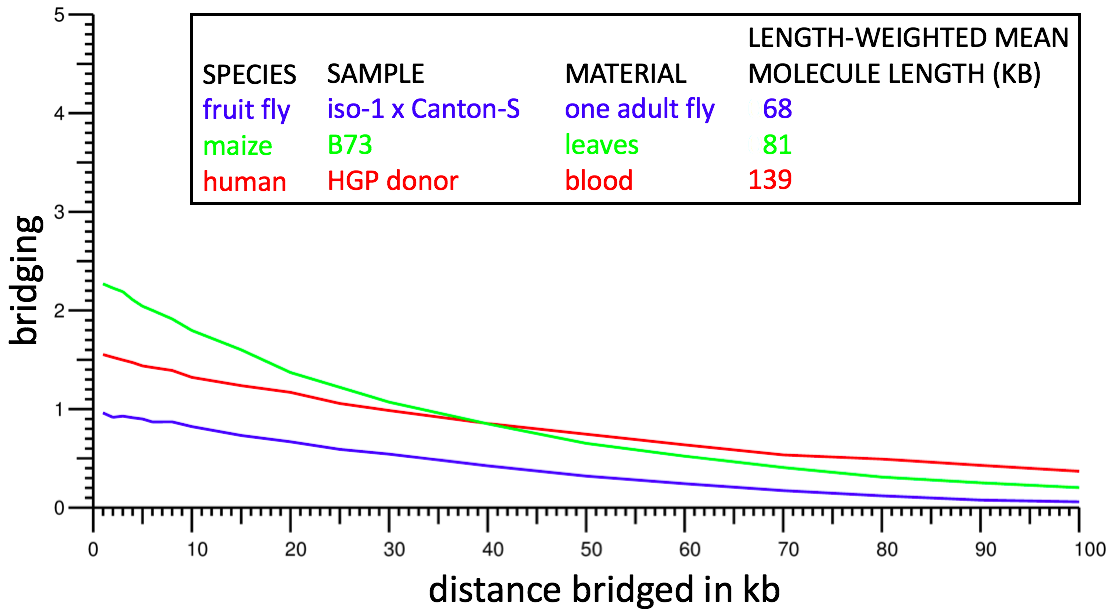
For example, from the red curve, one sees bridging of ~1 at 50 kb: on average, for two kmers separated by 50 kb, the human dataset contains one molecule for which both kmers are in the dataset.
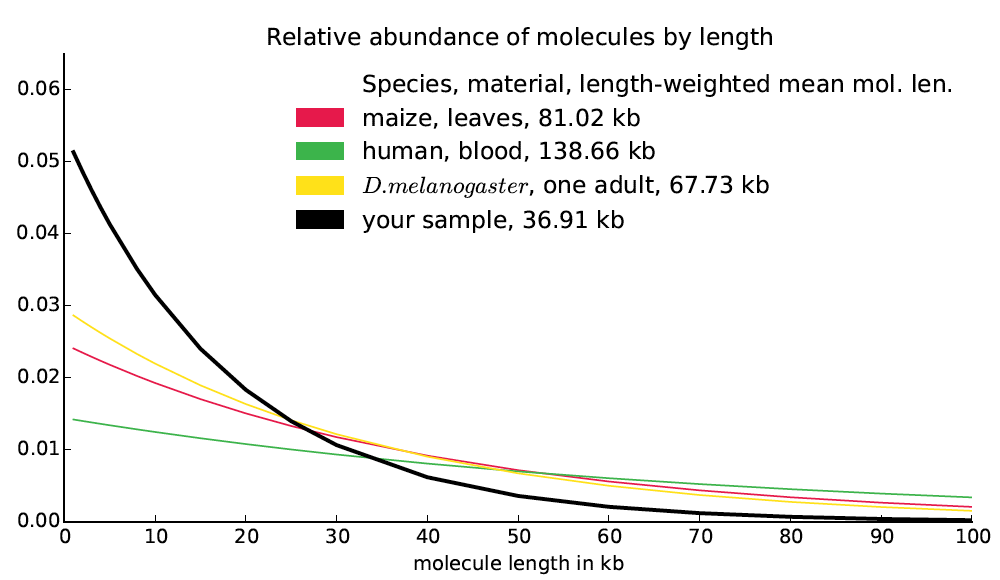
A naive model of molecule breakage suggests that molecule lengths might be distributed exponentially. Moreover a naive model of read distribution suggests that if b(d) is the bridging at distance d, then the second derivative b″(d) would be proportional to the number of molecules of size d in the library (derivation not shown). Finally, we observe empirically that the bridging functions computed from actual datasets are almost exactly exponential. Based on these observations, it seems likely that the frequency function for molecule lengths is approximately exponential and in fact closely approximated by the exponential function best matching the bridging function (up to a constant multiplier). We treat this exponential function as reported by Supernova as the molecule length distribution and we compute the length-weighted mean molecule length directly from it. We also report this function, in the form of a graph, mol_length_dist.pdf, which looks like this:
Yes. The higher the coverage, the higher the bridging. However the effect should be nearly the same at all bridging distances, and thus the computed value for length-weighted mean molecule length should be relatively unaffected.
To bridge between two kmers, the reads from a molecule have to include both kmers. Since each molecule is sequenced to very low depth, it is actually a rare event for a molecule to include any two given kmers on it.
Yes. Lowering quality has the same effect as lowering coverage.
In our experience, bridging never fails for normal datasets. Perhaps there is something very peculiar about your dataset. If not, please let us know!
This is not unusual. One reason could be that nicks in your DNA (unobservable on a gel) led to subsequent fragmentation.
As best we can tell, in most cases, yes. If the DNA has been size selected (not something we normally do internally), the distribution may be perturbed somewhat, but we have not seen cases where it is far from exponential.
If m is the length-weighted mean molecule length as reported by Supernova, and b = 2/m, then the function is f(x) = b * exp(-bx), where x is the molecule length.
No, but using the exponential function described above you can reproduce the molecule size plot shown in mol_length_dist.pdf or create a model histogram.
At least 20 kb, and in fact DNA shorter than 50 kb can be problematic, depending on complex characteristics of the genome that are unpredictable in advance of generating data. Thus the answer is really 'as long as possible', and how long this is depends on the input material type. Some information about what is possible using current best practices can be gleaned from our results for test datasets, which shows the measured DNA length in each case. Cell lines should yield 100 kb or longer DNA. Similarly blood should yield very long DNA. Please see our detailed instructions for preparing DNA, and let us know about your experiences. We would like to share successful protocols with the community.