Supernova2.1, printed on 04/05/2025
| Analysis software for 10x Genomics linked read products is no longer supported. Raw data processing pipelines and visualization tools are available for download and can be used for analyzing legacy data from 10x Genomics kits in accordance with our end user licensing agreement without support. |
Supernova is a fundamentally new genome assembly algorithm. Using 10x Linked-Reads, Supernova produces phased assemblies of homologous chromosomes over multi-megabase ranges. While this creates new power to carry out biological analyses, fully exploiting that power requires understanding the nature of a Supernova graph assembly and how it is represented. We anticipate that some users will want to use Supernova assemblies “out of the box” as input to other programs, while other users will choose to innovate to exploit Supernova’s novel capability. We have given some thought to a range of such use cases and we provide a number of output options that we describe here. Should you require advice for a novel application, or encounter something unexpected, please give us feedback at support@10xgenomics.com.
Supernova assemblies are graphs that can be represented as FASTA files. Here we see a toy example:
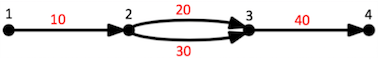
Each edge represents a DNA sequence, that is, a portion of a single strand of DNA. Each edge has left and right vertices. For example, edge 10 has left vertex 1 and right vertex 2. Edges that abut each other (like edges 10 and 20) overlap at their junction by K-1 bases. (Currently K = 48.) Any path through a Supernova graph is a list of edges, for example 10,20,40 is a path in the above graph. A sequence may be associated to it by concatenating successive edges and deleting the shared K-1 bases at each junction. Such a path might be encoded in a FASTA record as:
>55 edges=10,20,40 left=1 right=4 ver=1.3 style=2
ACTTTAGACGGGGACCCTAGACTTACTTGAGAAAACGTTTTTACACTTACCA
The sequence identifier (e.g. >55) is a simple serial number, counting up from 0, and otherwise has no semantic meaning. Following it, we augment the information usually found in a FASTA file by adding these tags:
| Field | Sample Value | Meaning |
|---|---|---|
| edges | 10,20,40 | path of edges in the assembly that the sequence describes |
| left | 1 | identifier of vertex at left end of the path |
| right | 4 | identifier of vertex at right end of the path |
| ver | 1.3 | Supernova output format version number |
| style | 2 | output style identifier |
| By default, edges are condensed to first..last (e.g. edges=10..40) to avoid very long FASTA headers that may confound downstream processing. This is fully controllable and discussed in the section on output generation. |
Now let's consider the architecture of a Supernova assembly, and the representation choices engendered by it.
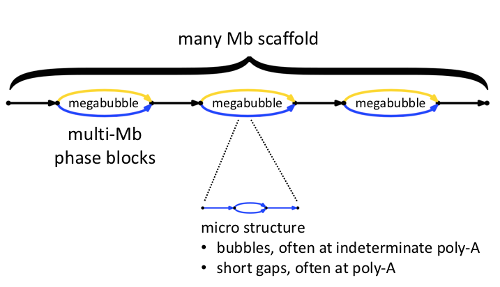
Here we see a high-level view of one scaffold. Within the scaffold are megabubbles, each representing a fully phased portion of the assembly, shown with gold and blue edges representing loci on homologous chromosomes. Successive megabubbles are not phased relative to one another.
In general, each edge shown in the scaffold diagram actually contains within it ‘micro-structure’, describing sequences that are not fully determined. As we will explain in the next section, the representation of micro-structure in FASTA output is under your control. You may choose to ‘see everything,’ or you may choose to suppresses such micro-structure in the FASTA output, resulting in longer FASTA records, but with some loss of information.