Long Ranger2.1, printed on 04/05/2025
| Analysis software for 10x Genomics linked read products is no longer supported. Raw data processing pipelines and visualization tools are available for download and can be used for analyzing legacy data from 10x Genomics kits in accordance with our end user licensing agreement without support. |
High-level metrics are displayed based on the library type, whole genome (WGS) or targeted libraries like whole exome (WES). The library type is called out in the header of the SUMMARY view as whole genome or targeted (black boxes below). Targeted libraries are identified based on supplying a target BED file to Long Ranger for analysis.
Since WGS libraries contain SNP information for exons and introns the percent of SNPs phased and percent of genes phased are displayed. On the other hand, targeted libraries are mainly restricted to coding exons so only the percent of genes phased is displayed (arrows below). Exons may not contain heterozygous SNPs and are not evenly distributed throughout the genome. As a consequence targeted libraries have shorter N50 Phase Blocks than WGS libraries. The side-by-side example below illustrates this point as the same genome was used for WGS and WES libraries (yellow boxes). Finally, the coverage histogram reflects that the sequencing depth is drastically different for WGS and targeted libraries (red boxes).
There are 3 main differences between the haplotype view of a whole-genome (WGS) and a whole-exome (WES) sample. First of all, in WES, you will only see SNVs coming from targeted regions (usually the exons) of the genome on haplotype tracks, whereas in WGS, you will see SNVs coming from exonic and intronic regions of the genome. As a result, there tends to be fewer phased SNVs, and shorter phased blocks in WES relative to the WGS sample. Secondly, signals in the coverage track tend to coincide with the location of exons in WES sample, and there should not be such a correlation in the WGS sample. Lastly, you will only find breakpoints near exonic regions in the WES sample. But breakpoints should be not limited to exons in the WGS sample.
The pattern of barcode overlap in the STRUCTURAL VARIANTS view differ between whole genome and whole exome samples. The two screenshots below show the same region in a whole genome and a whole exome sample. Both samples were generated through the Chromium platform and had comparable molecule lengths. Notice how in the exome sample the barcode overlap matrix has a "checkered" pattern, with high color intensity at exons and diminishing intensity away from the exons.
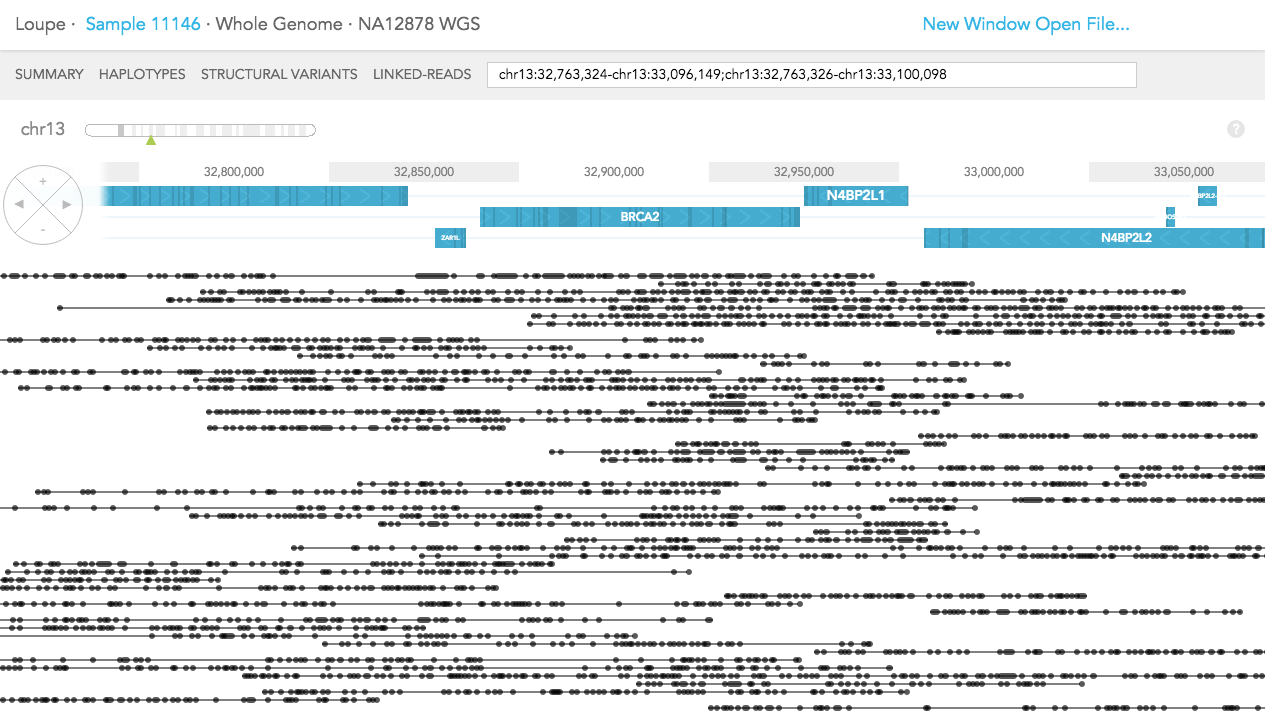
The difference in LINKED-READS view between WES and WGS samples is due to location of reads in the genome. In LINKED-READS view, WES sample will mostly have reads near targeted (mostly exonic) regions. However, WGS sample should have reads throughout entire genes. In the example of BRCA2 below, in the WES sample, most reads stem from exonic regions. Although there are some reads covering short introns. In contrast, in the WGS sample, Linked-Reads are distributed throughout the BRCA2 region.
Whole Genome:
Whole Exome: