Cell Ranger6.1, printed on 04/20/2024
The cellranger multi pipeline outputs an interactive summary HTML file named web_summary.html that contains summary metrics and automated secondary analysis results. If an issue was detected during the pipeline run, an alert appears on this page. More information about alerts is provided in the Cell Ranger troubleshooting documentation. The web_summary.html file is also the starting point for quality control on a Cell Multiplexing experiment run through cellranger multi, introduced in Cell Ranger 6.0.
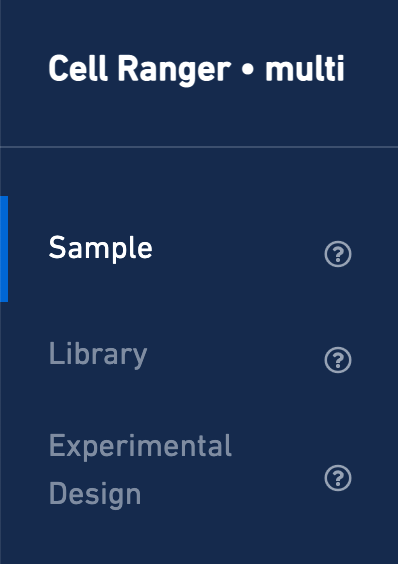
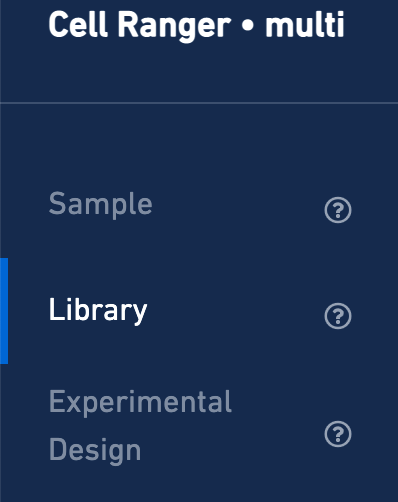
Here is an example web summary from a public dataset consisting of two multiplexed samples representing different cell lines, Jurkat and Raji. On the left, note there are three result views: Sample, Library, and Experimental Design:
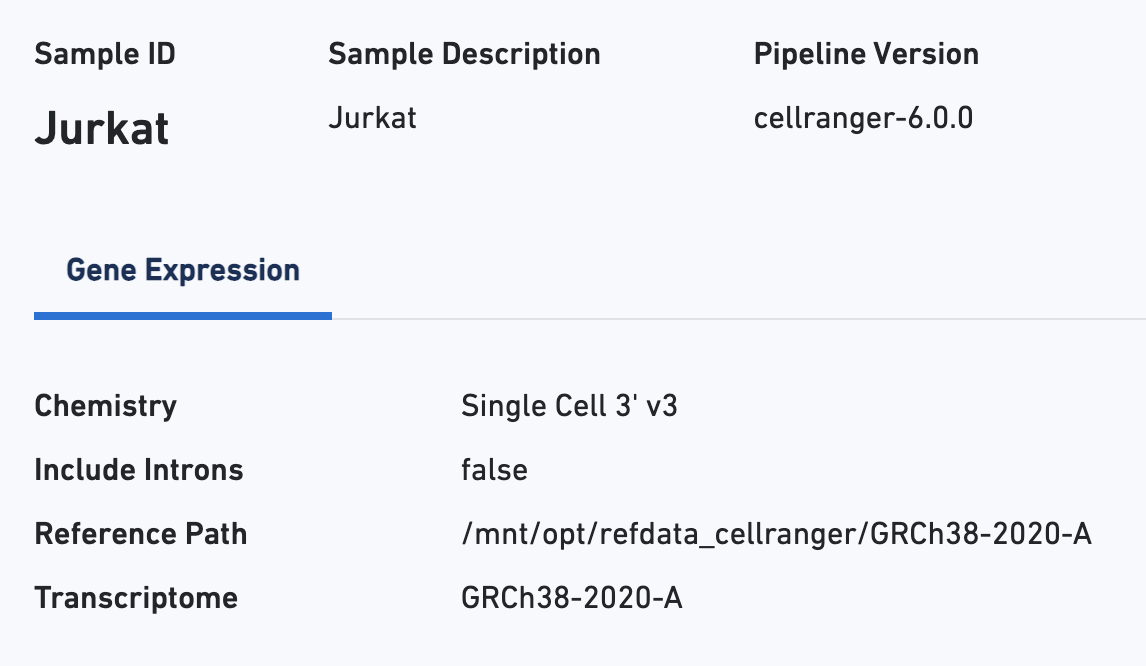
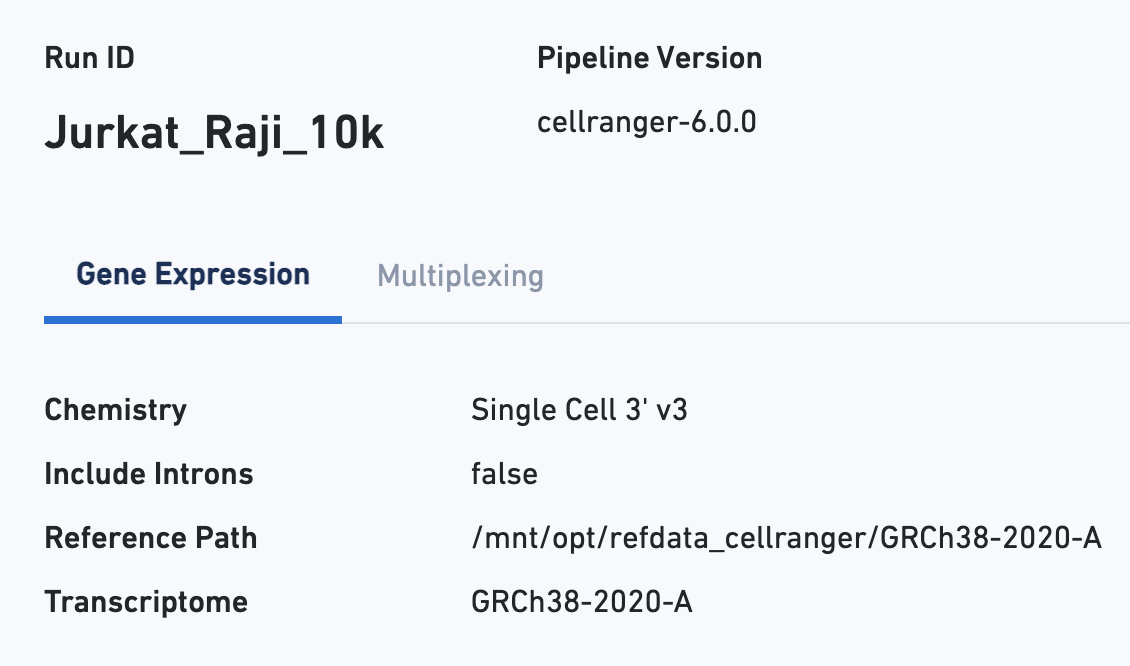
Starting with the Sample view, note key metadata, such as the reagent chemistry, transcriptome version, and reference path:
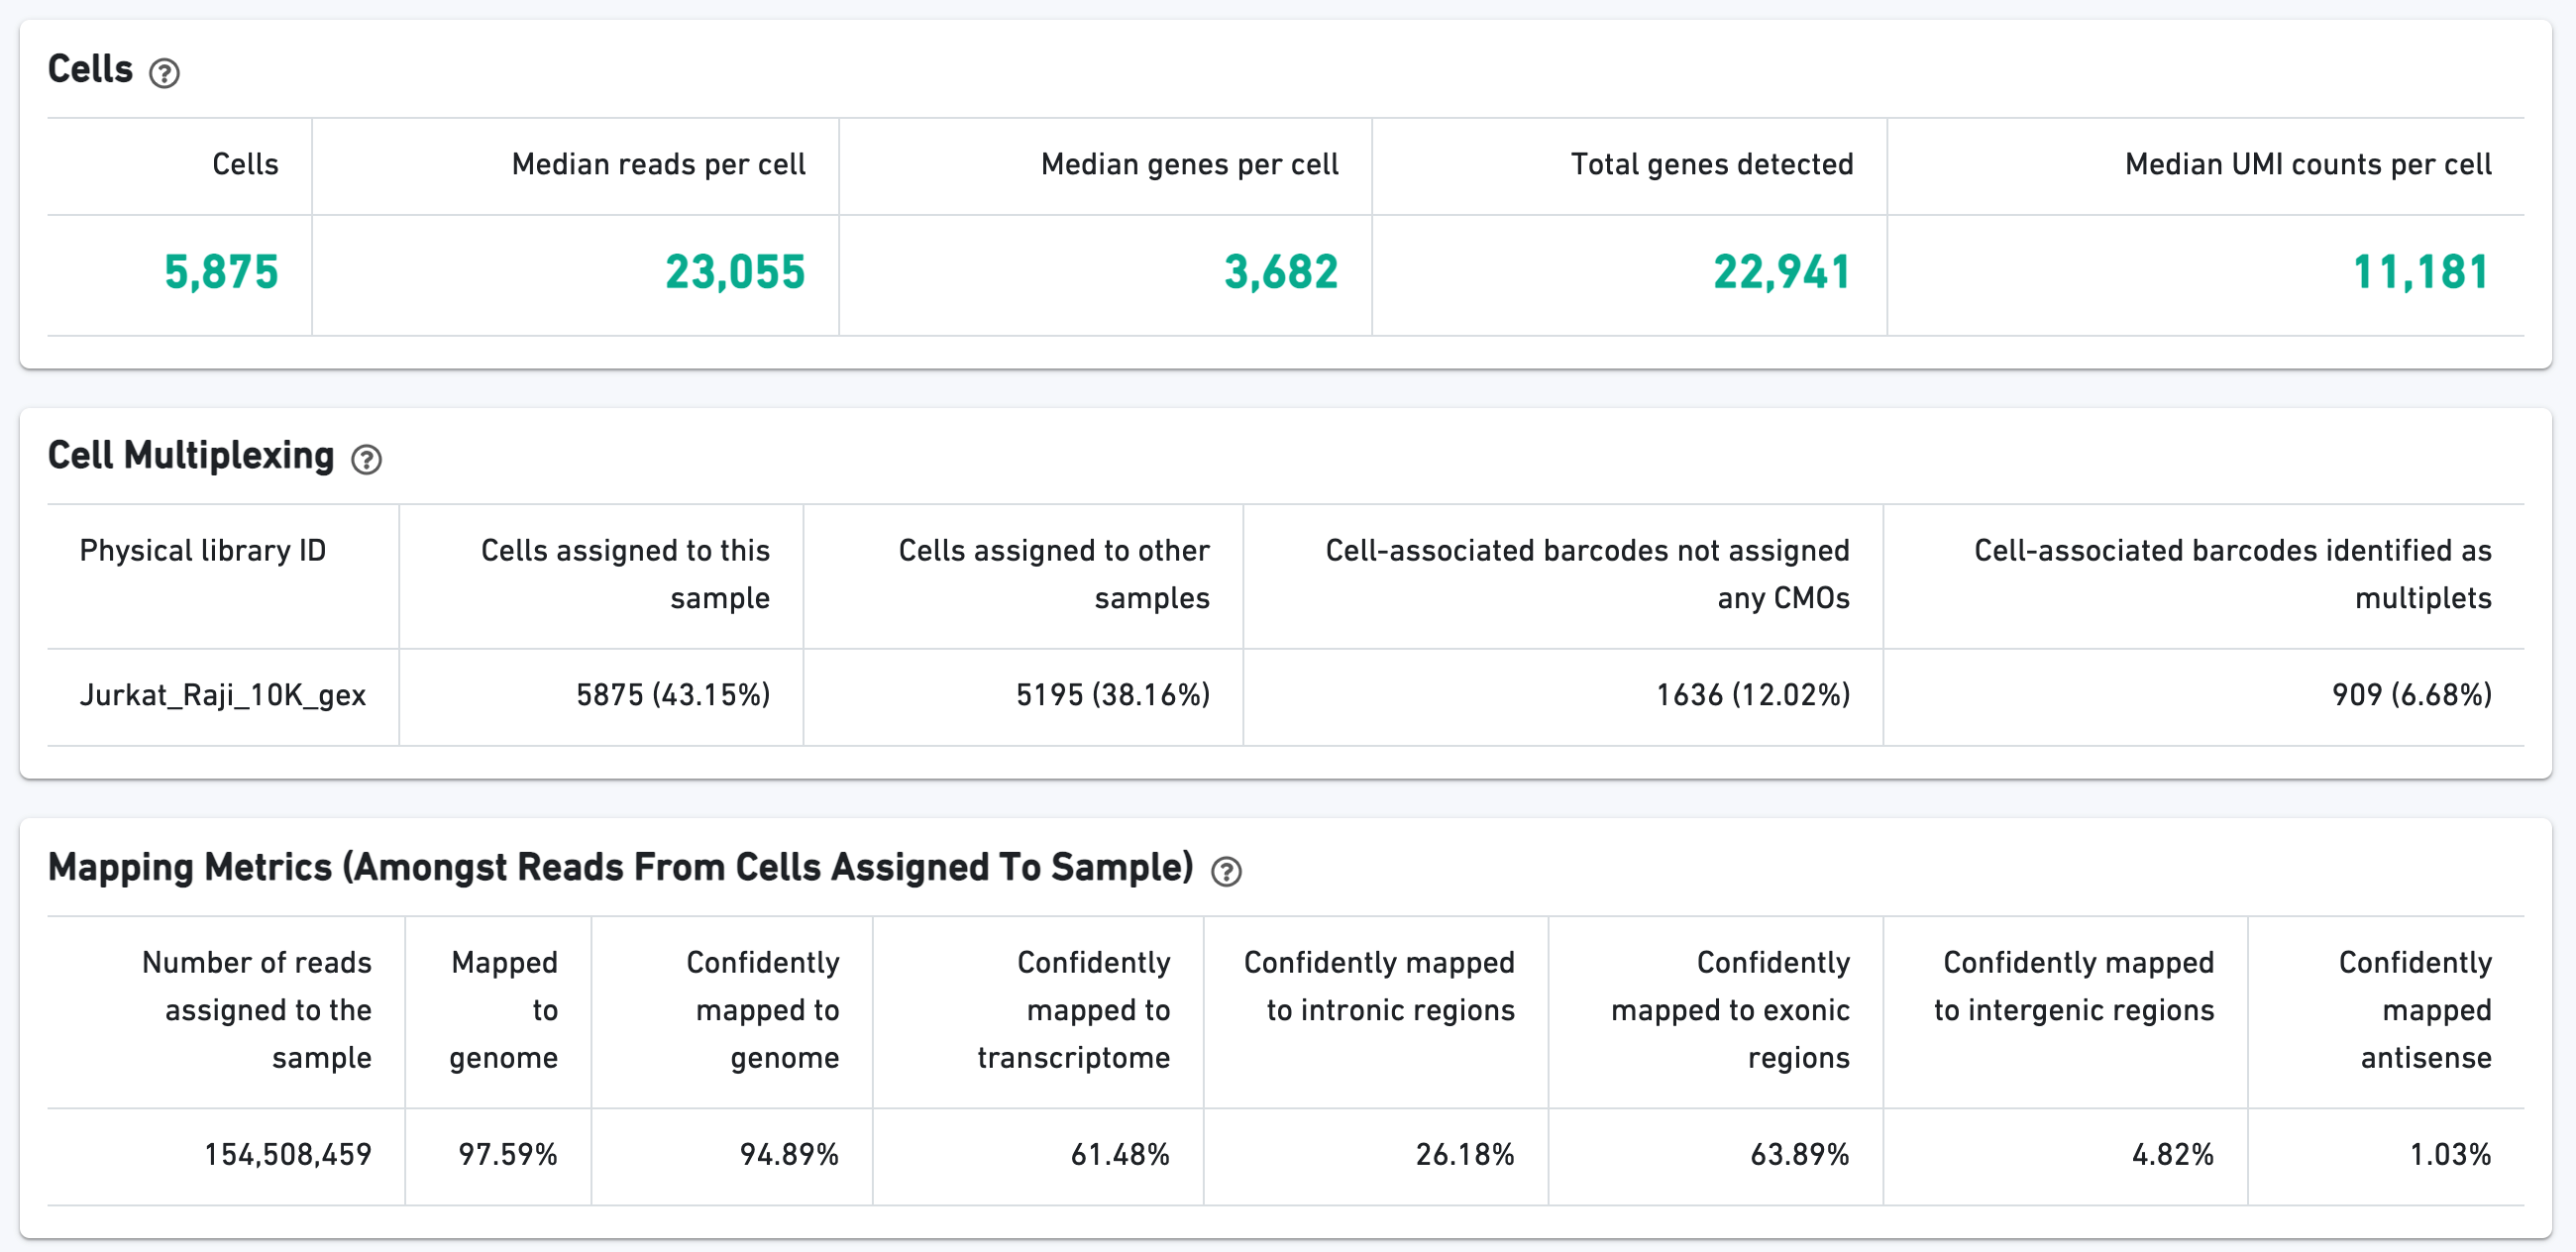
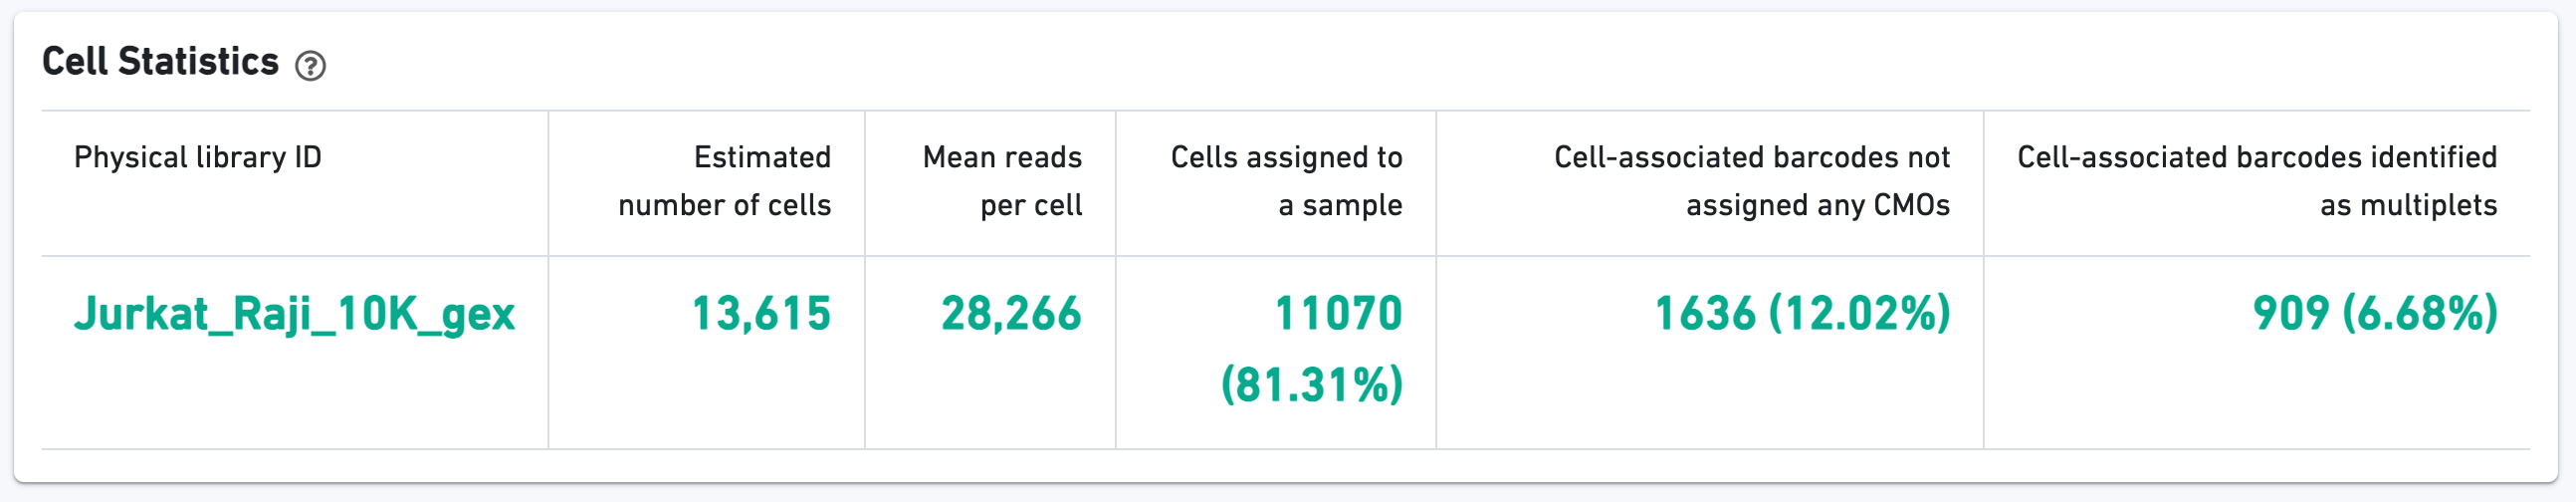
The Cells section contains the most important hero metrics for the sample. The Cell Multiplexing section contains metrics specific to Cell Multiplexing for the sample, and the Mapping Metrics section contains metrics regarding how reads mapped to the reference. Click the question mark ? symbol to read descriptions for each metric:
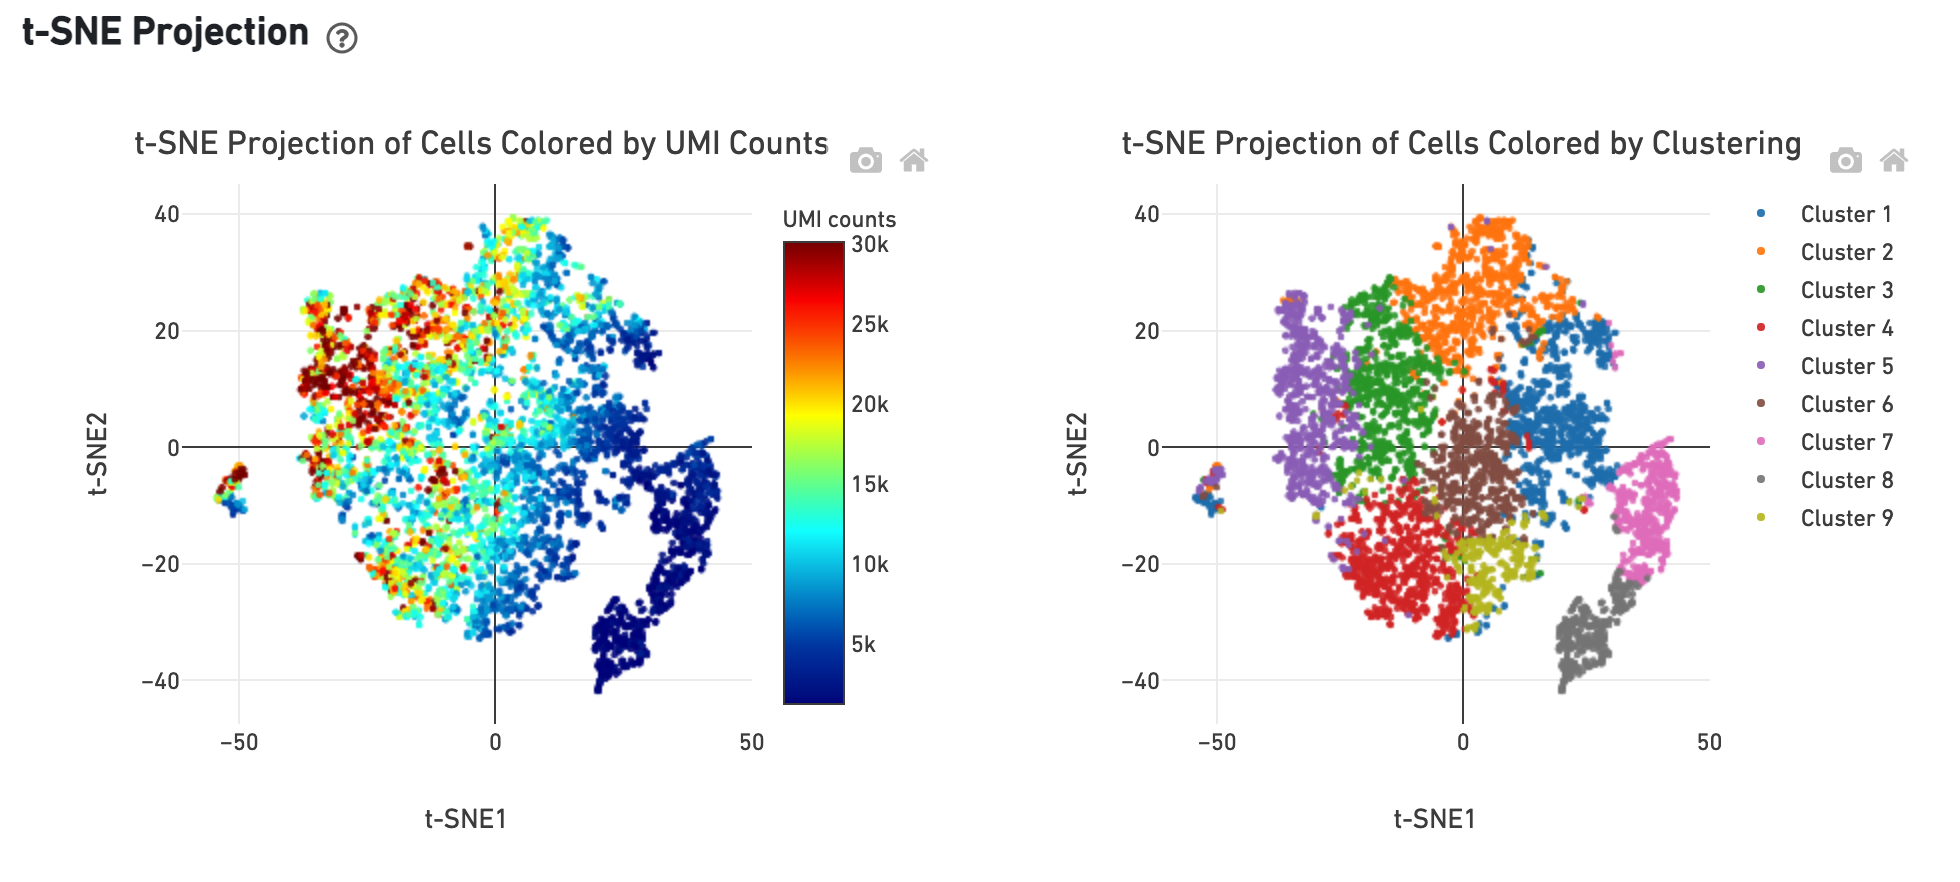
The t-SNE Projection section shows the data reduced to two dimensions, colored by UMI count or clustering (Graph-based by default). It is a good starting point to explore structure in the data.
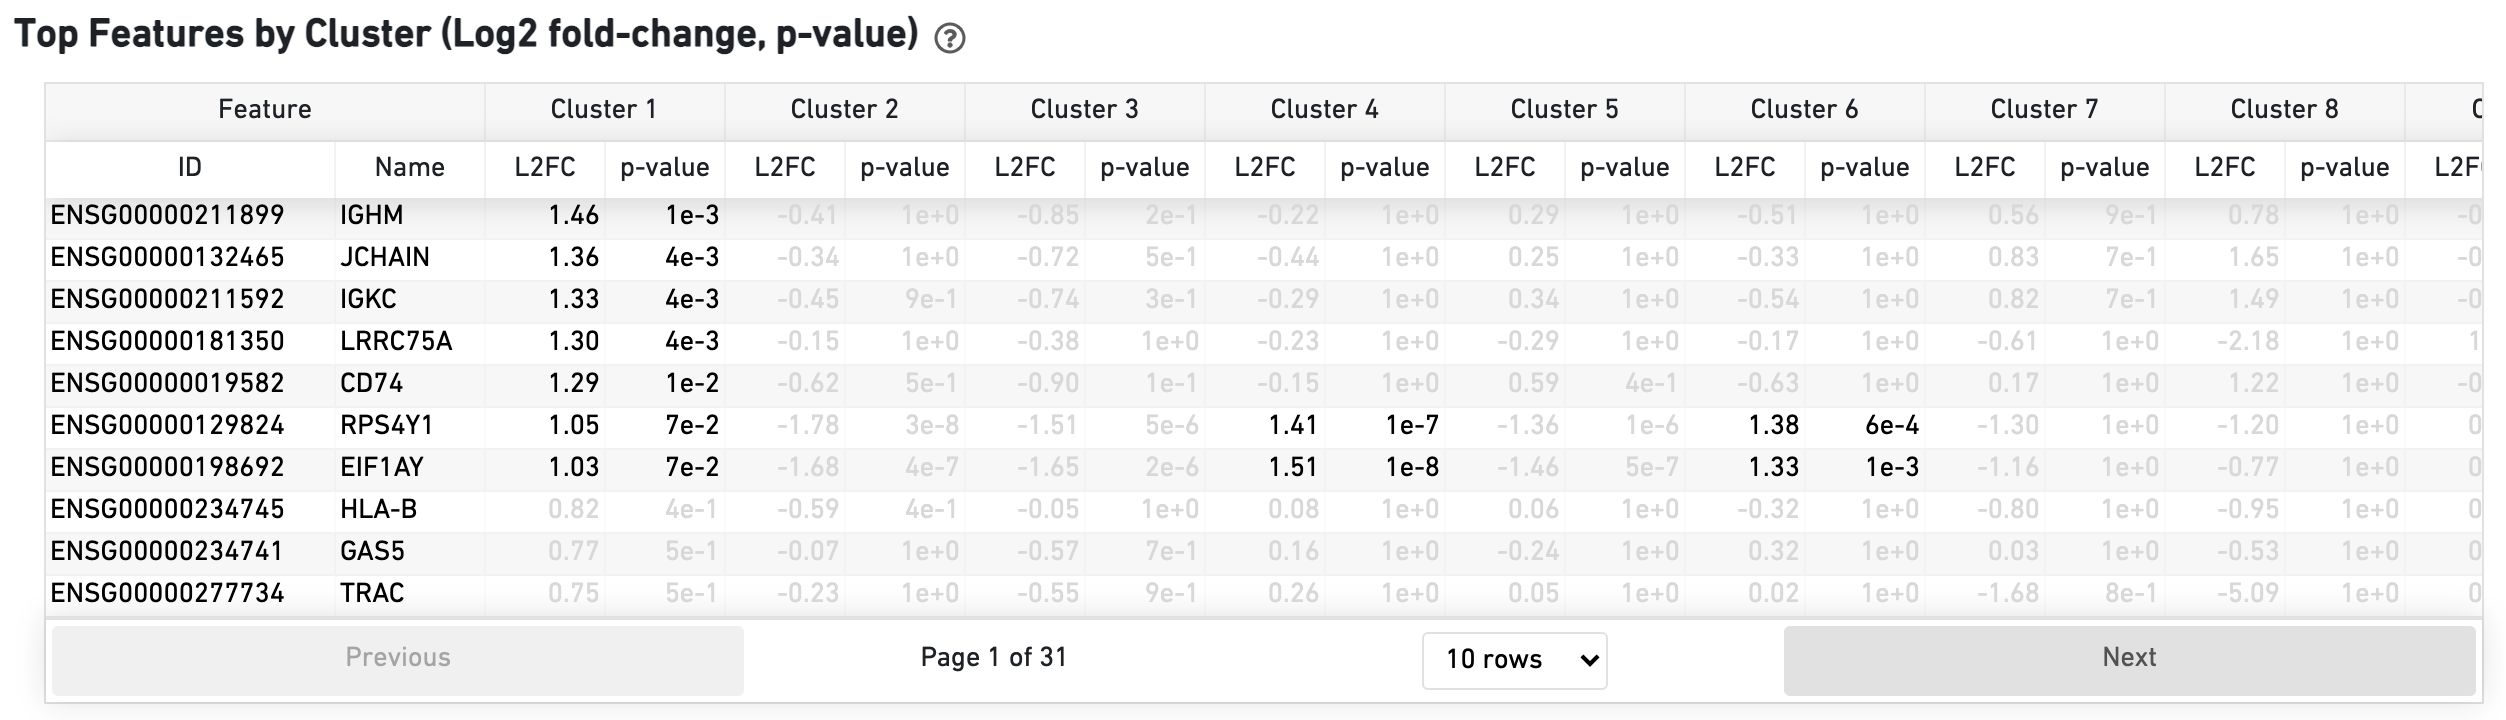
The Top Features by Cluster table shows the results of a differential gene expression analysis among clusters (Graph-based clusters by default):
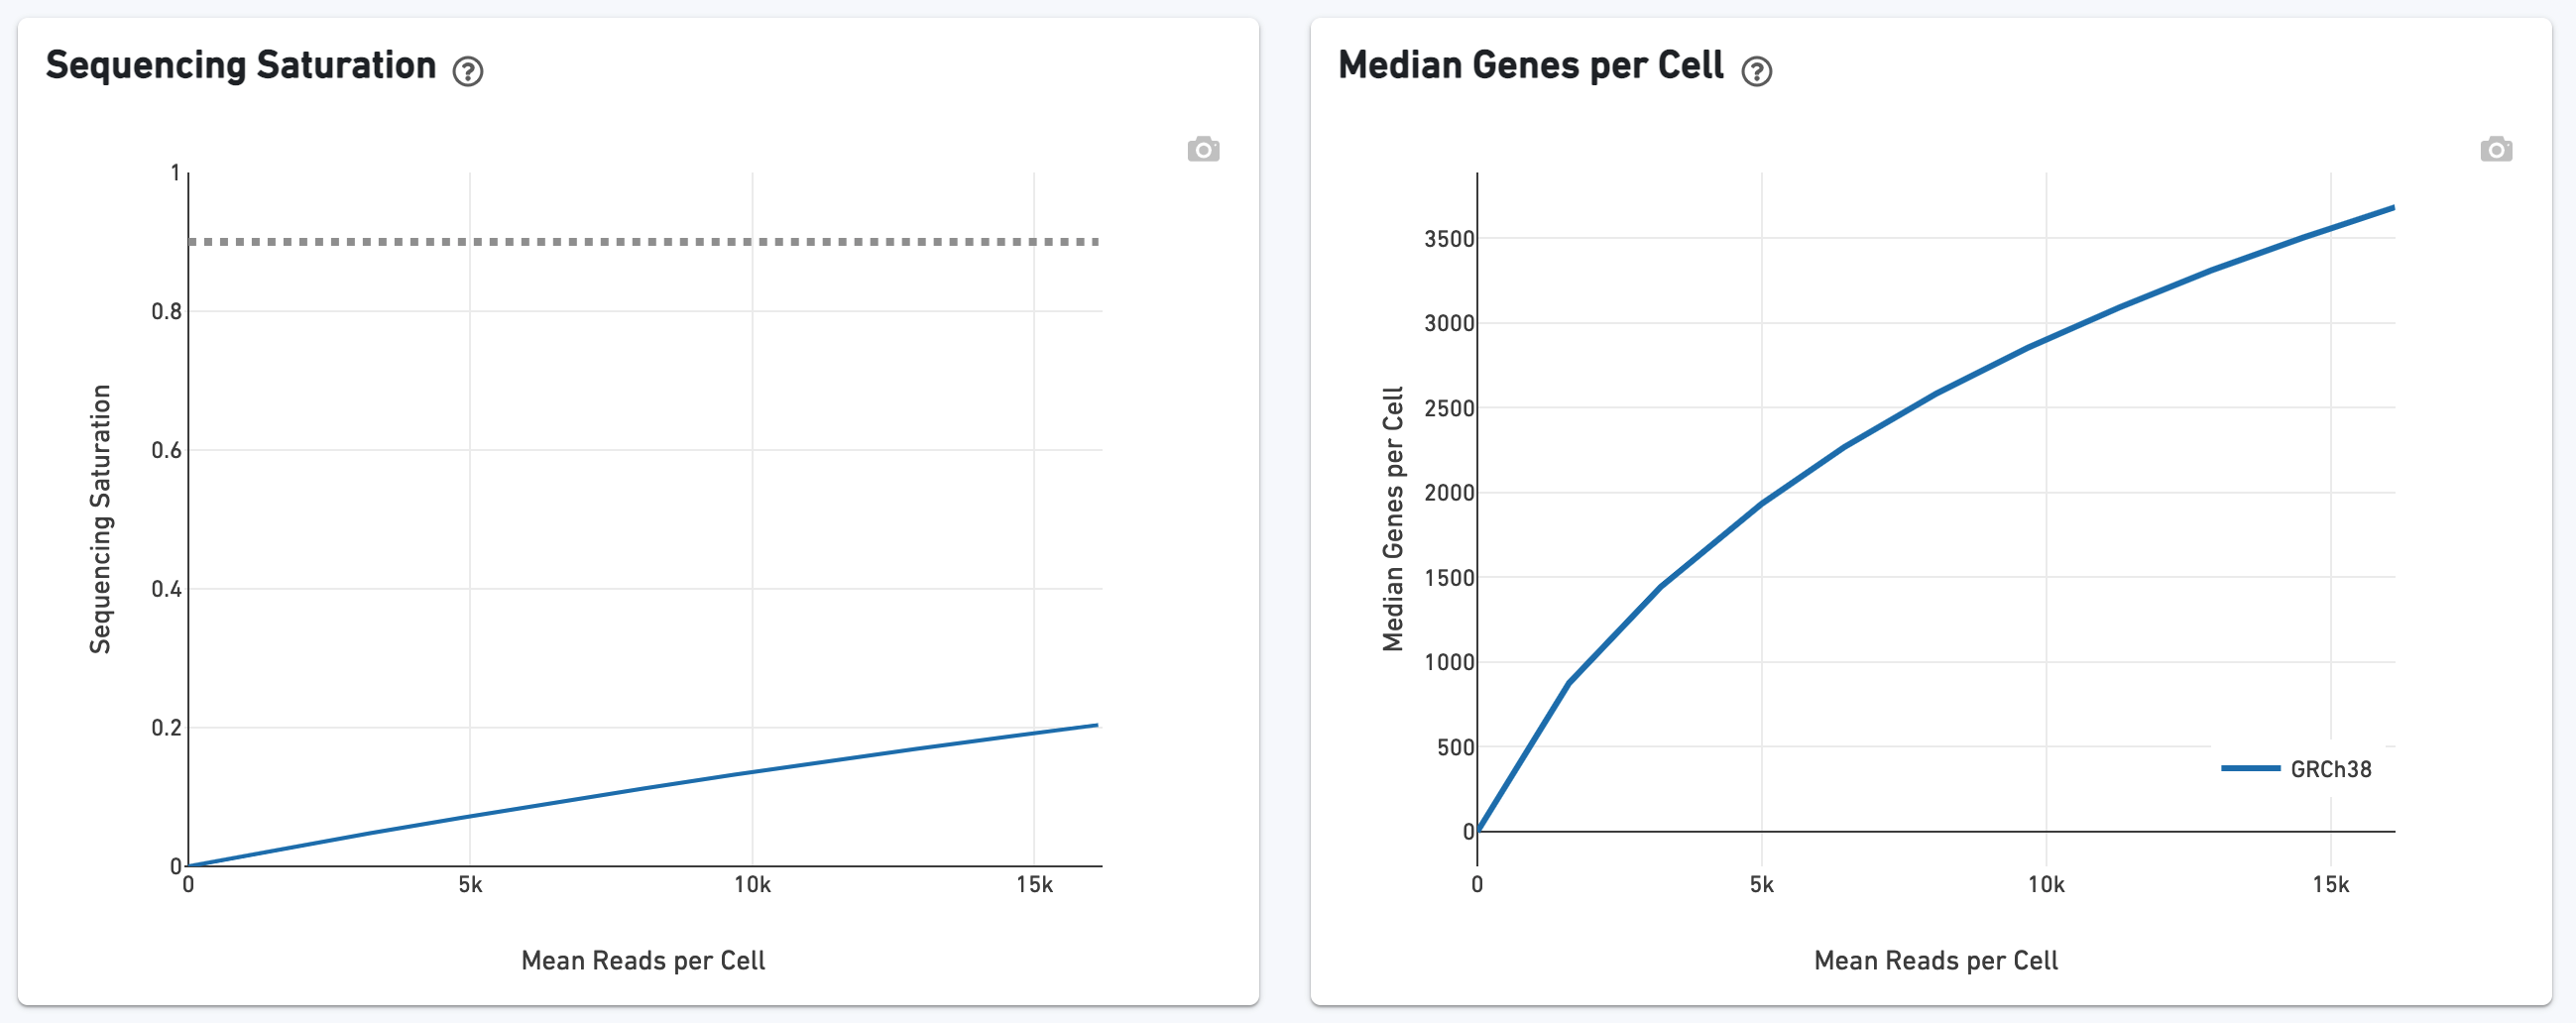
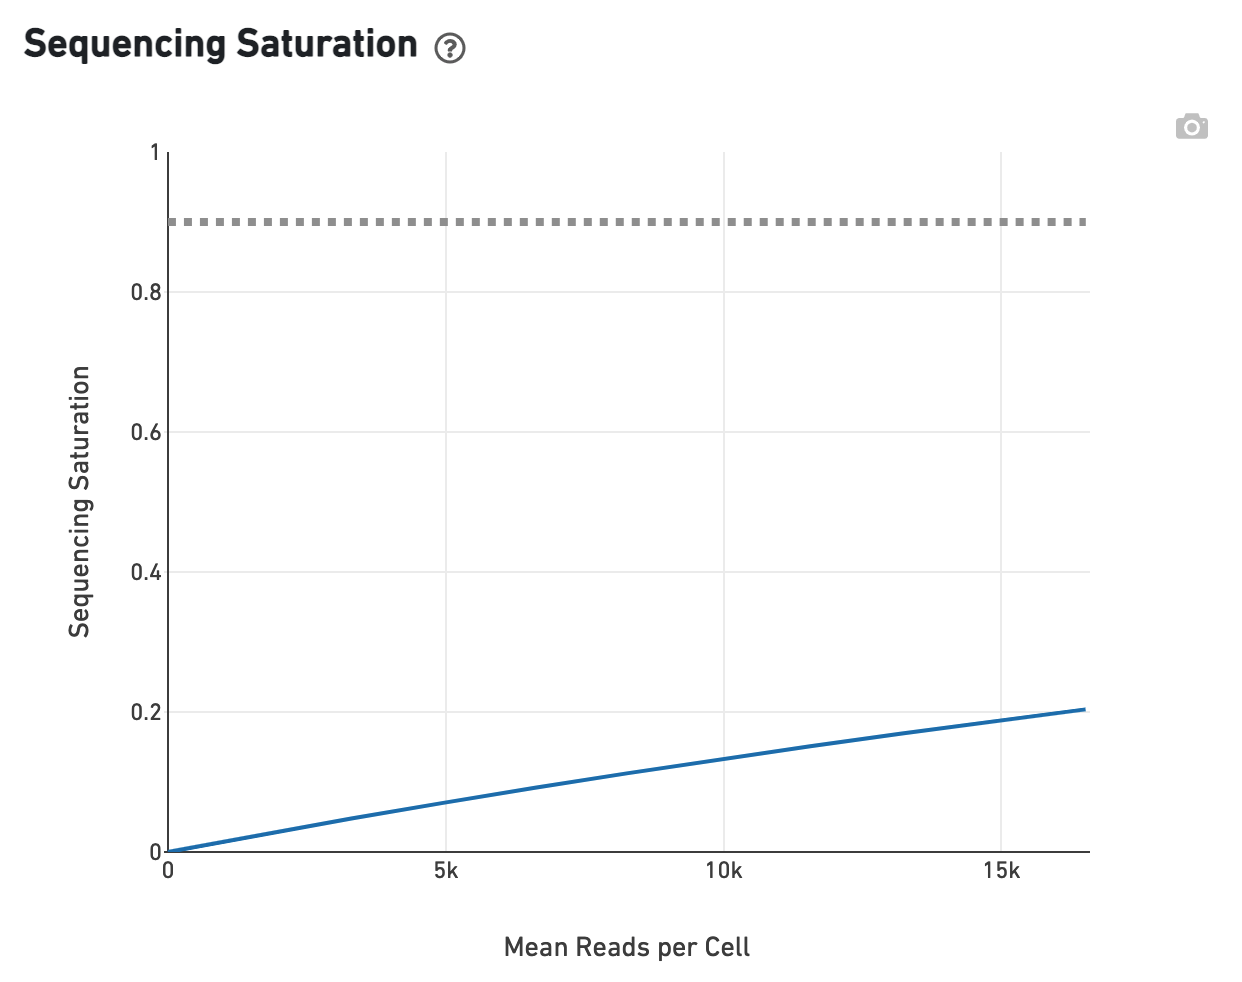
The Sequencing Saturation section enables one to gauge whether it is worth sequencing deeper, with diminishing returns of UMIs recovered.
Next switch to the Library view:
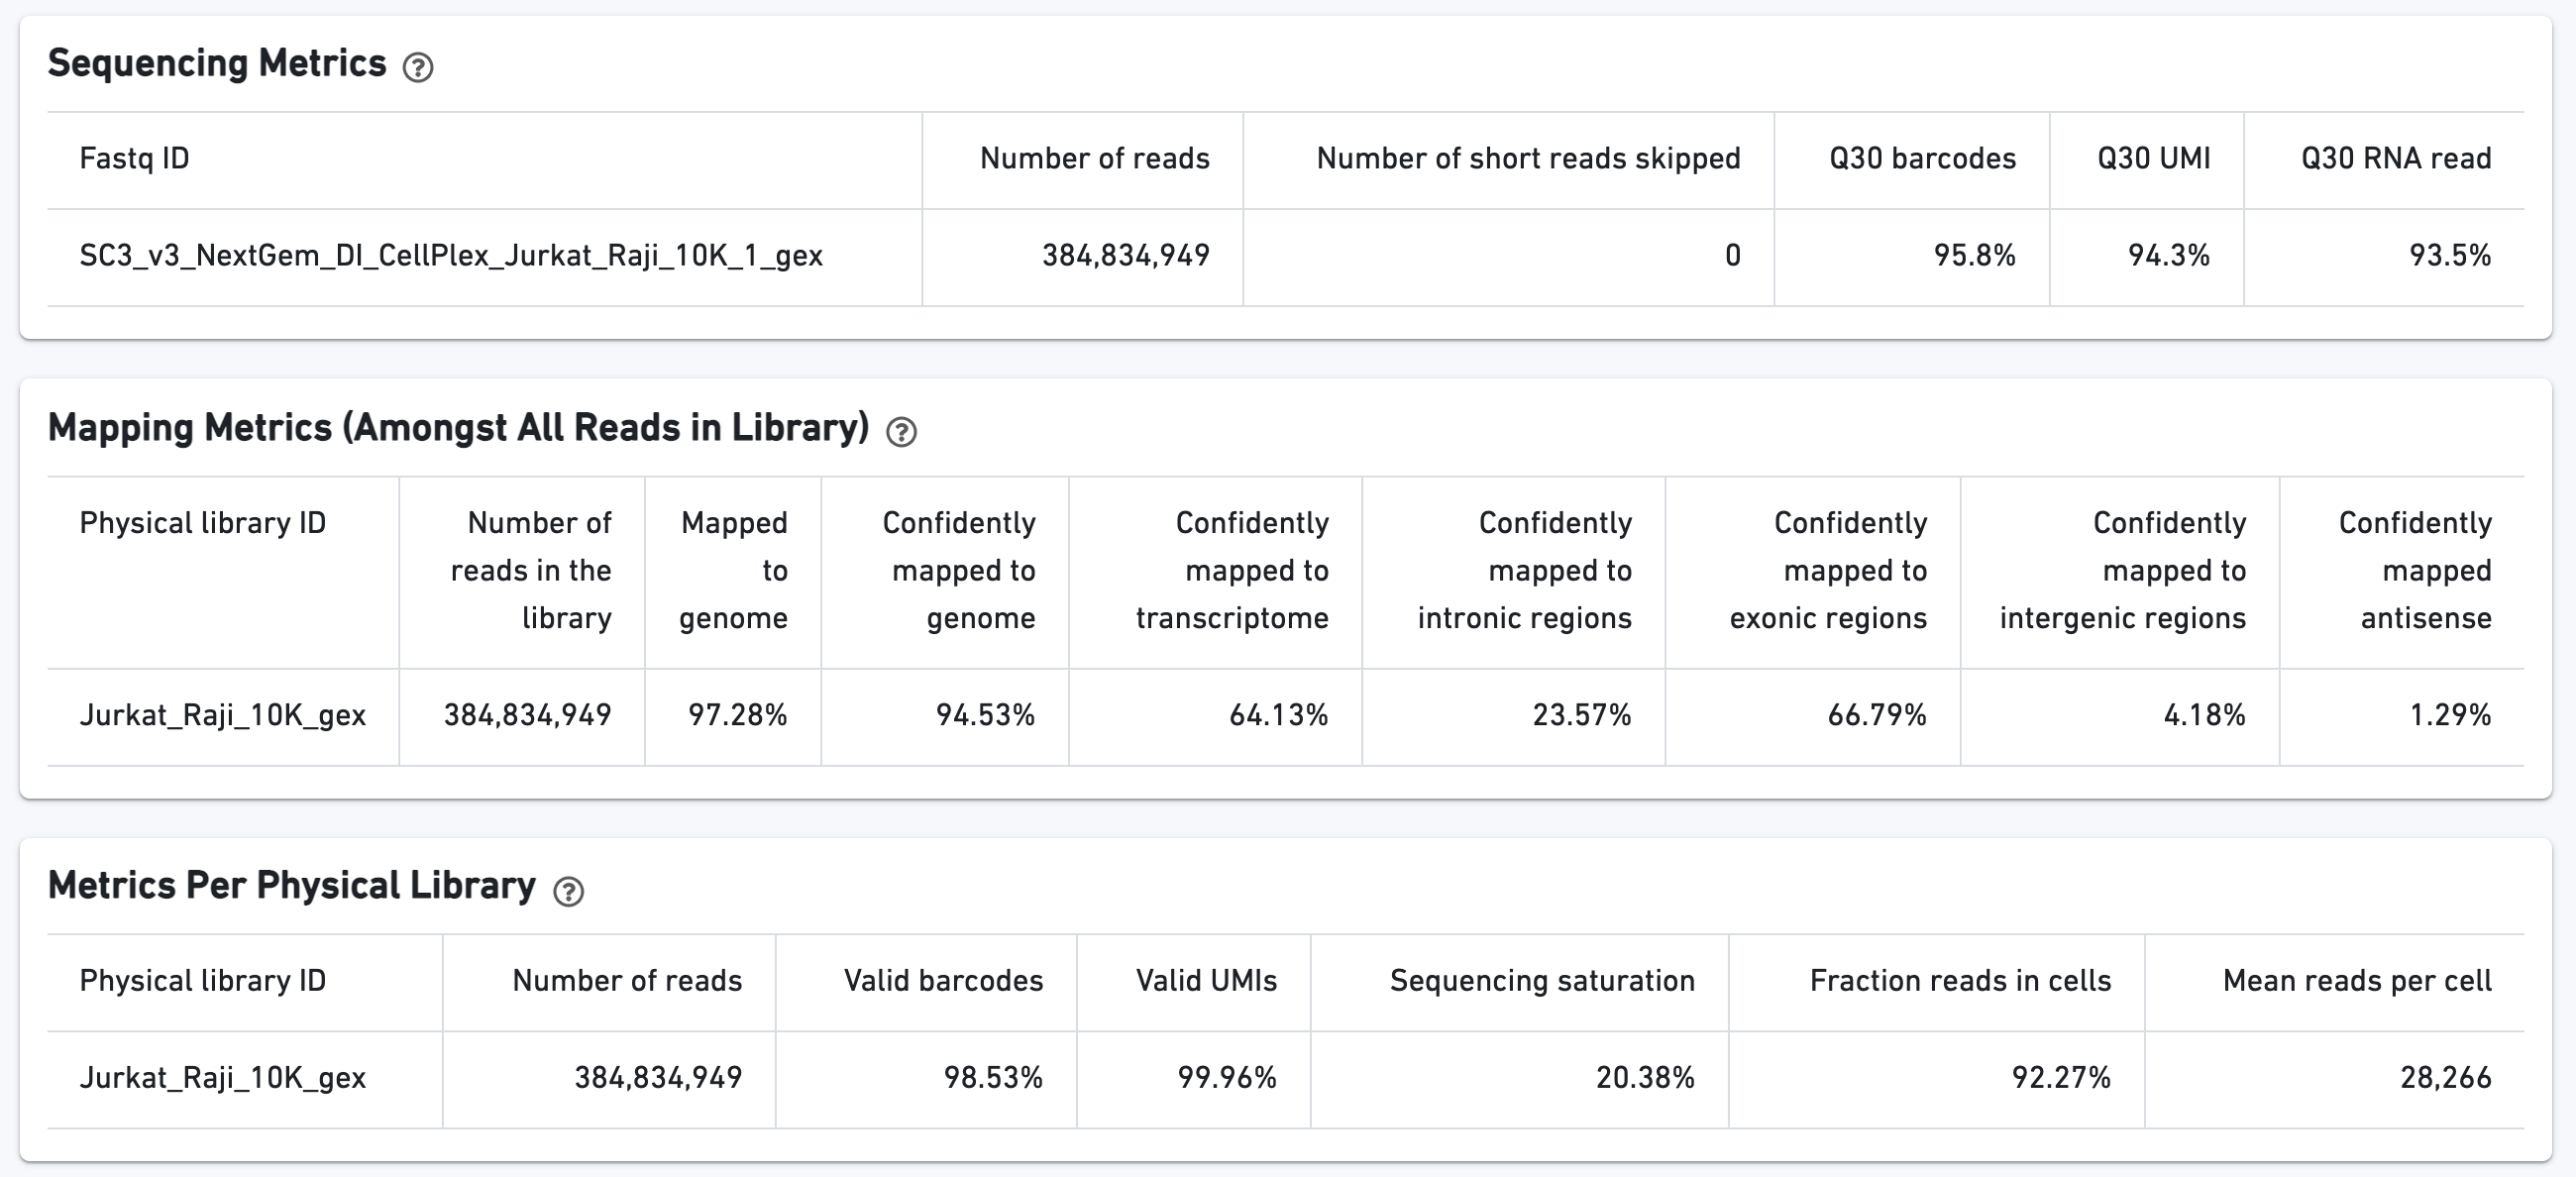
The Gene Expression tab shows metrics calculated for the physical library. As with the Sample view, metadata for the physical library is displayed on top.
The green hero metrics display the most important results of the experiment:
Additional metrics are displayed below the hero metrics. Click the question mark ? to read full descriptions for each one.
The GEX Barcode Rank Plot for the gene expression data enables one to assess sample quality. Ideally there is a steep drop-off separating high UMI count cells from low UMI count background noise:
![]()
The Sequencing Saturation plot allows the user to assess the relative tradeoffs of sequencing deeper or shallower. As sequencing saturation increases, the total number of molecules detected in the library increases, but with diminishing returns as saturation is approached.
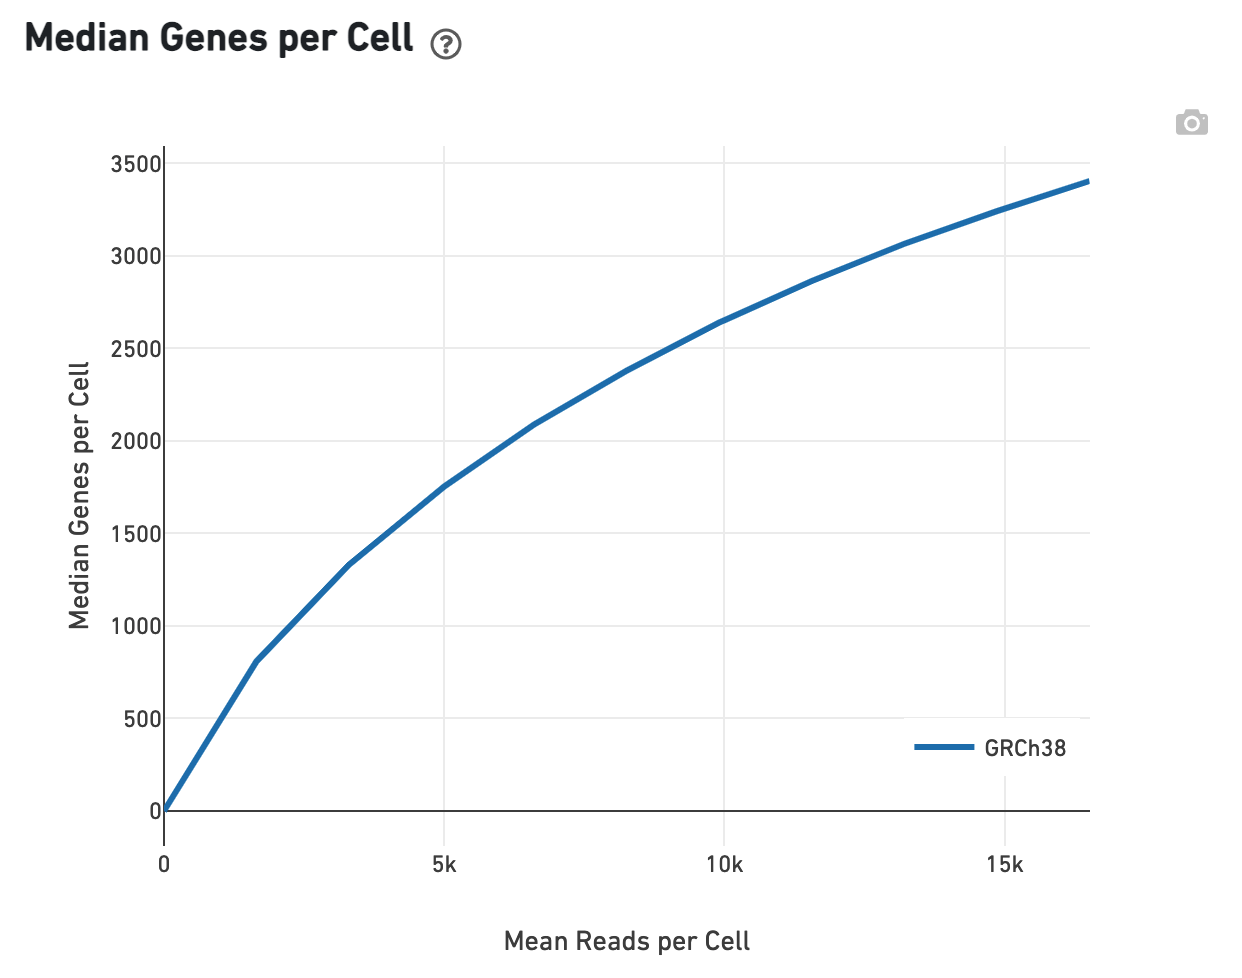
Likewise, one can assess the Median Genes per Cell in this plot:
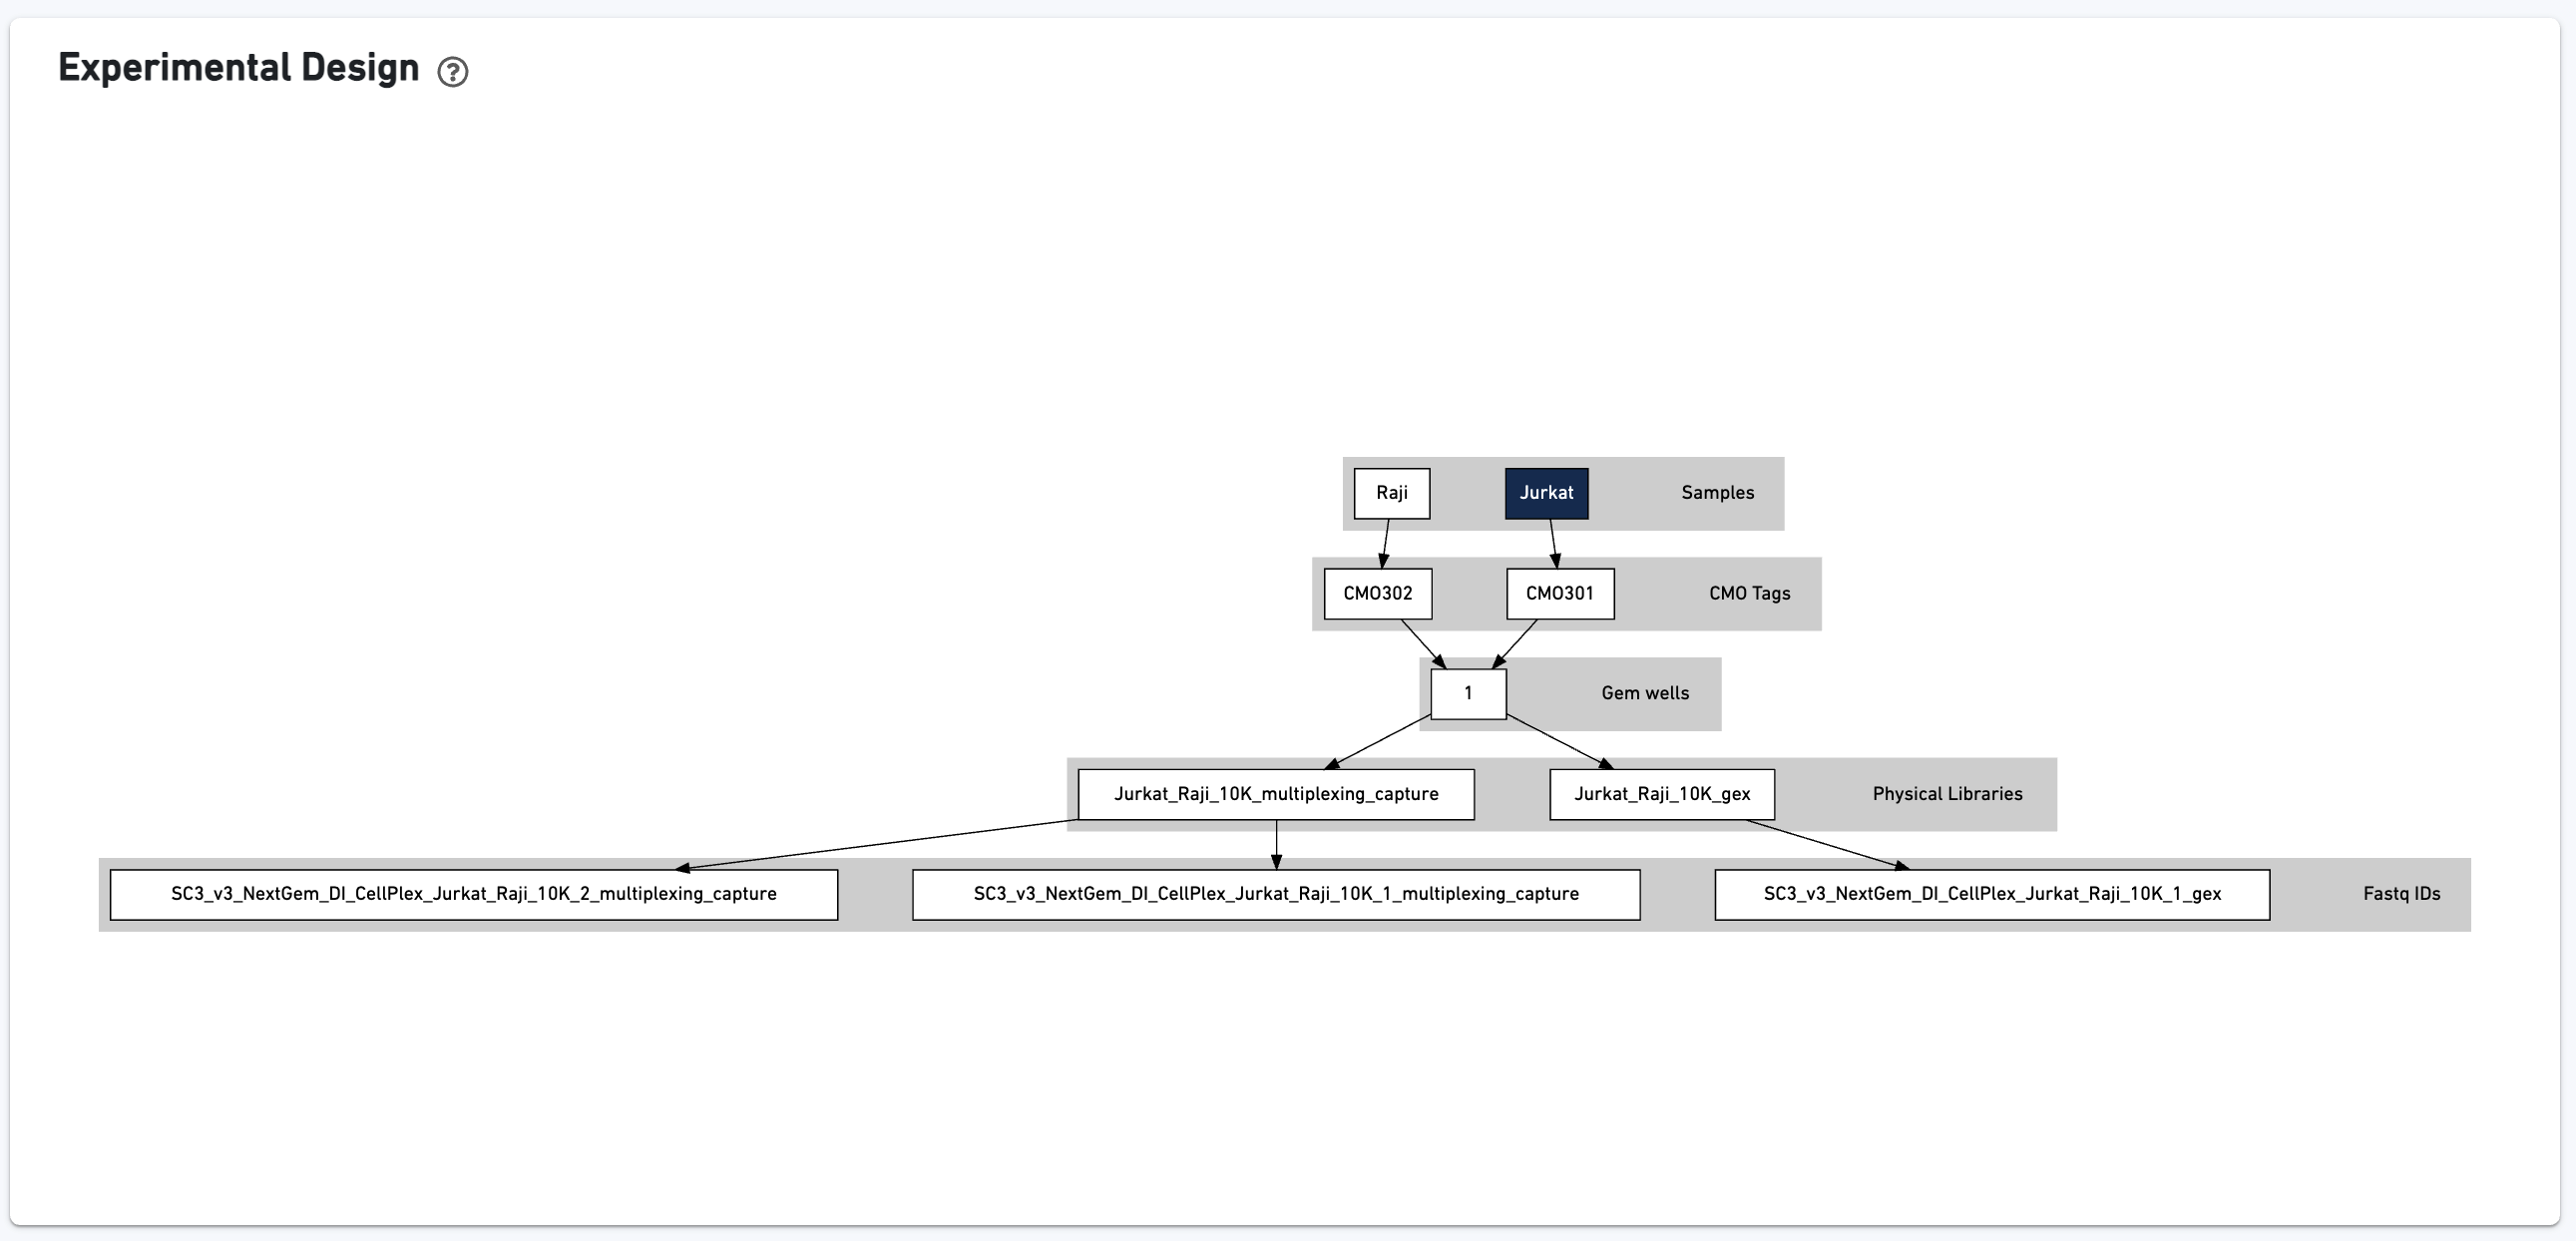
Finally, click the Experimental Design view:
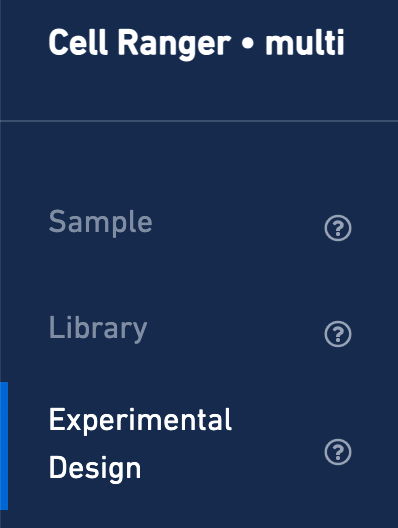
This view enables one to visualize the experimental design for the dataset, as interpreted by Cell Ranger:
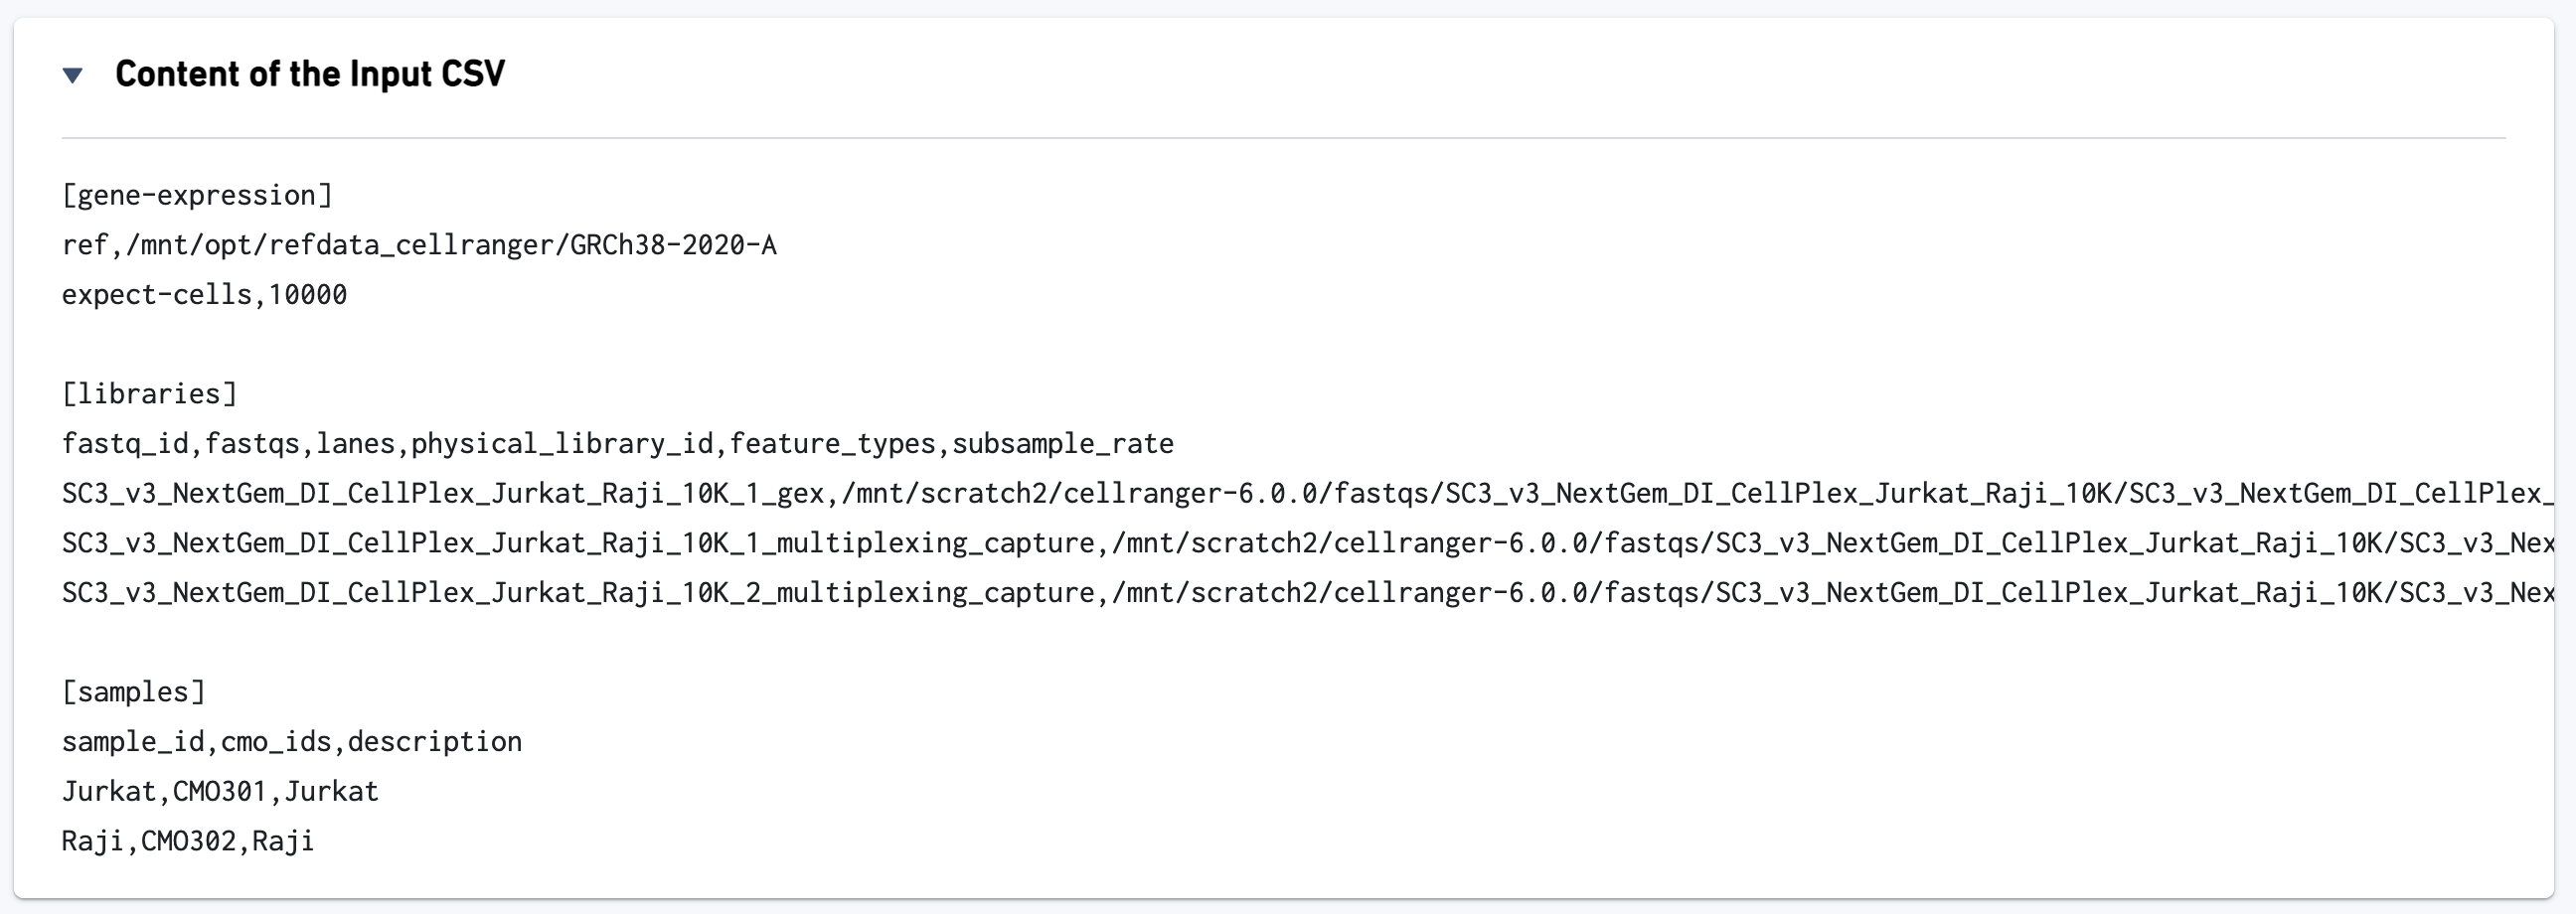
The input config CSV file is also displayed to help with troubleshooting:
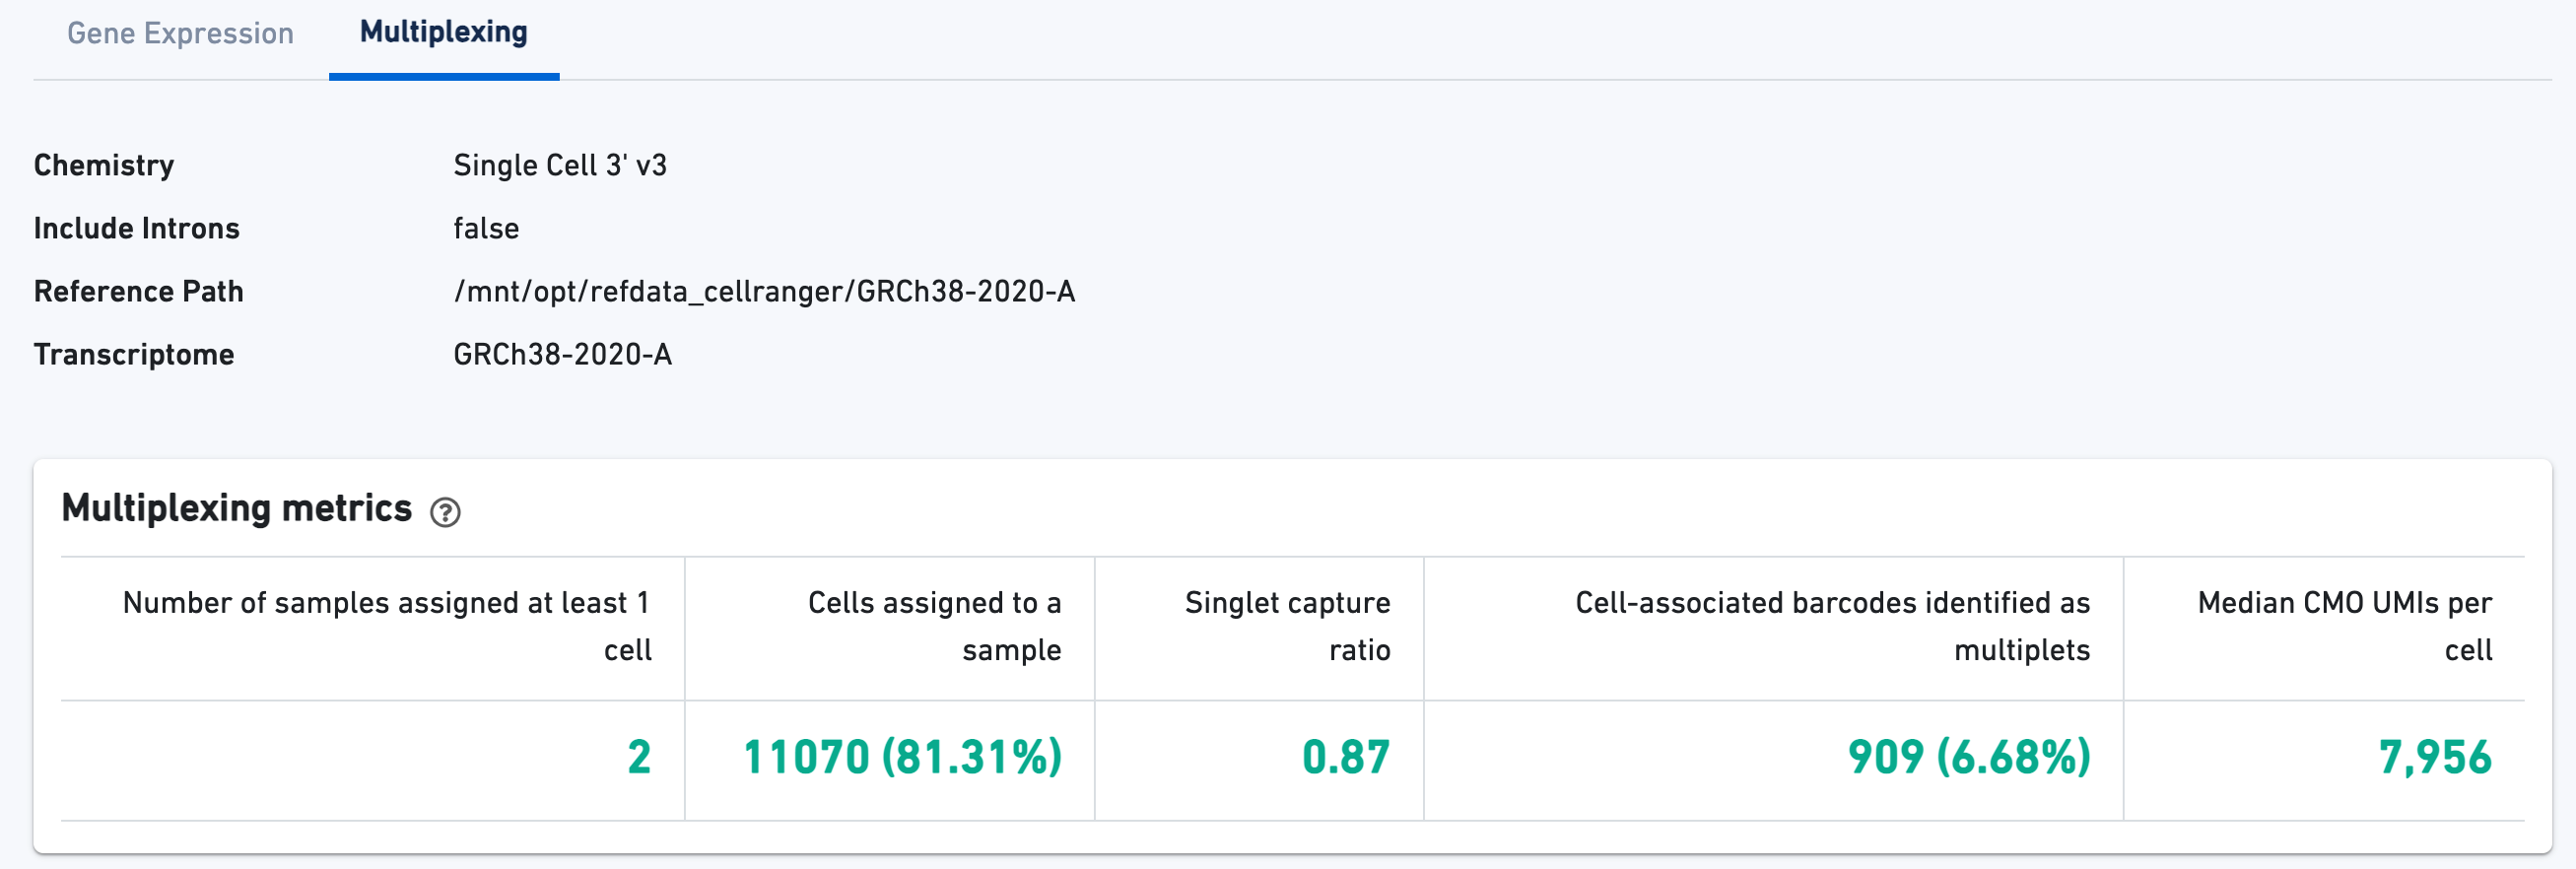
For Cell Multiplexing libraries, there will be an additional Multiplexing tab in the Library view that shows metadata and hero metrics for the CMO physical libraries:
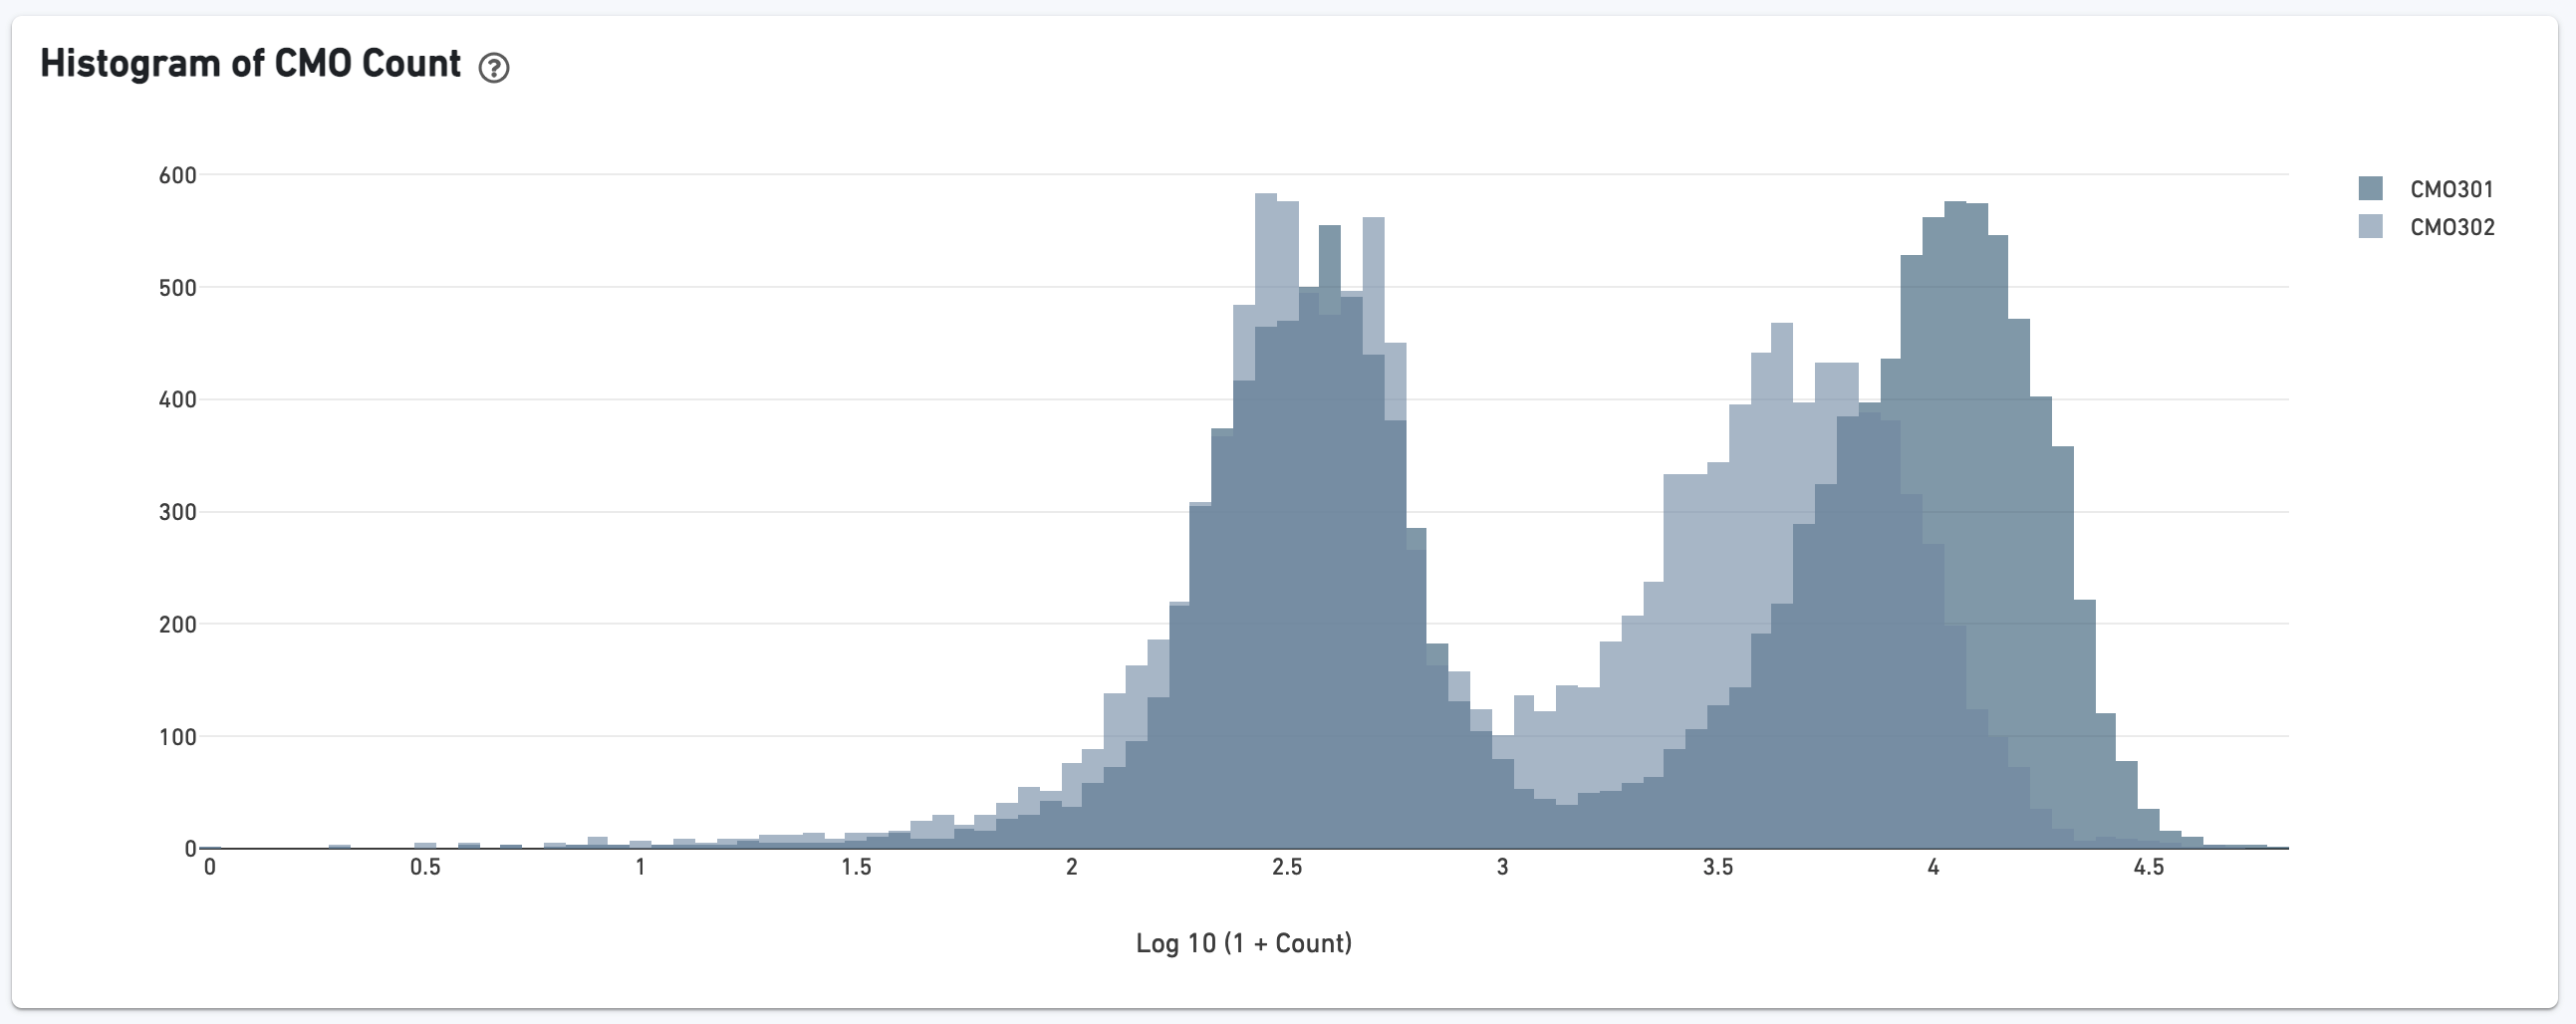
If the experiment went well, the histogram should show a bimodal distribution for each CMO. The left peak should be background noise, while the right peak is signal.
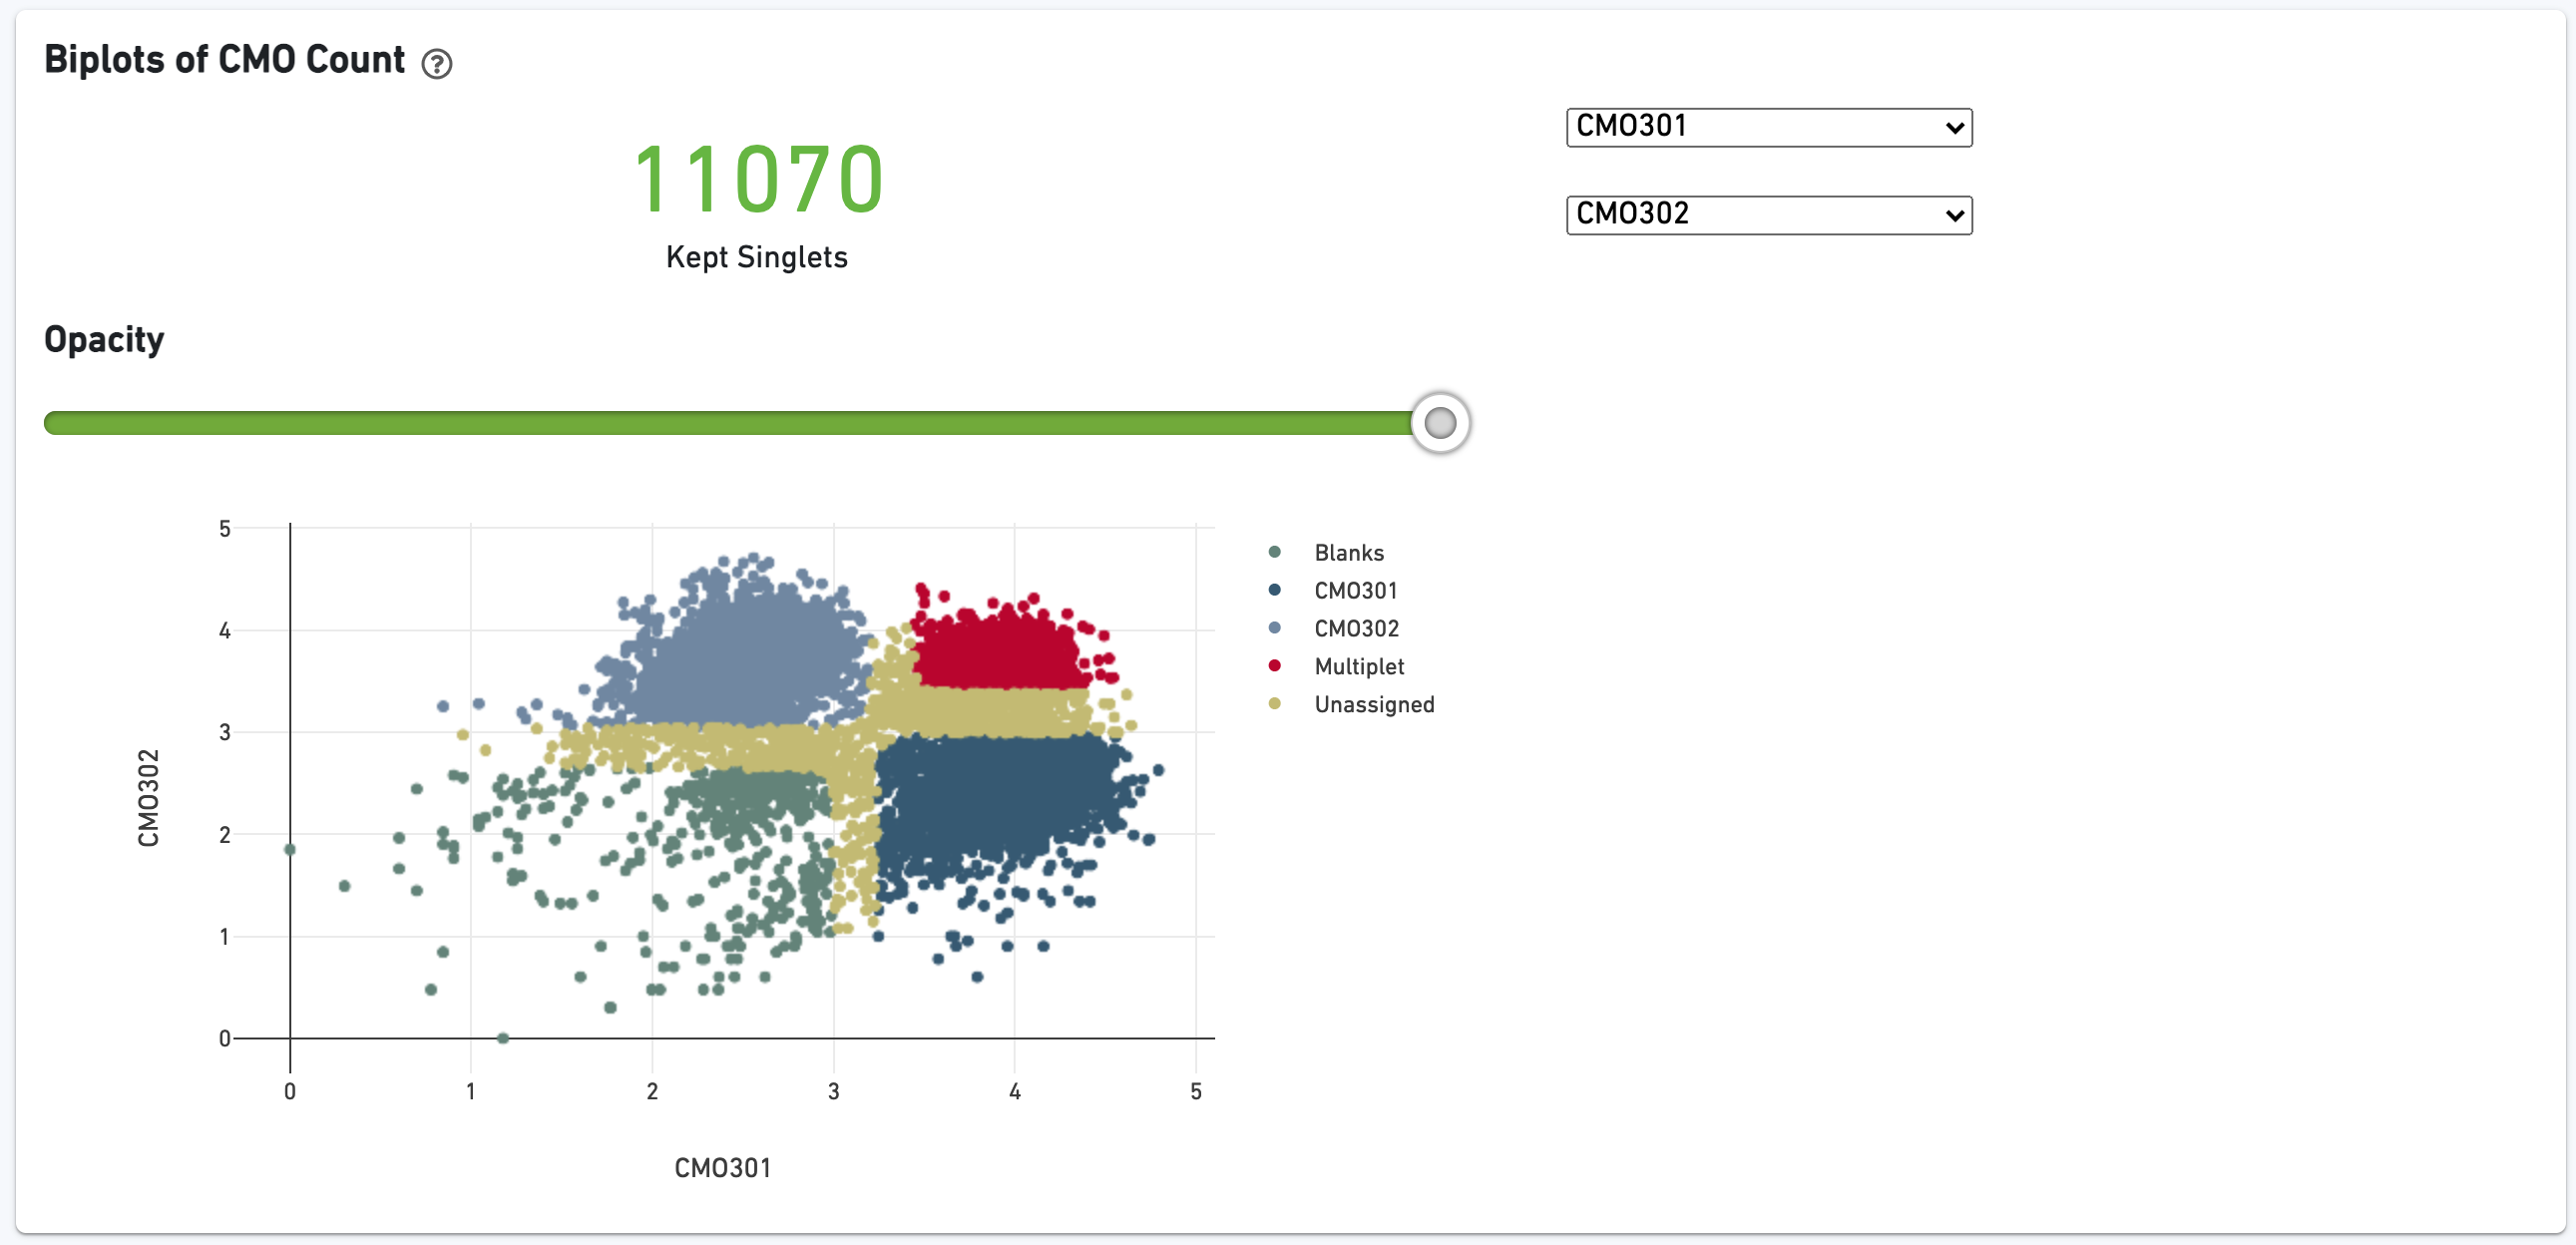
The biplot shows the CMO UMI counts for different cell populations: singlets, multiplets, blanks (not assigned any CMO), or unassigned, which are cells that were not confidently assigned to any of those states. The opacity slider enables the user to minimize over-plotting.
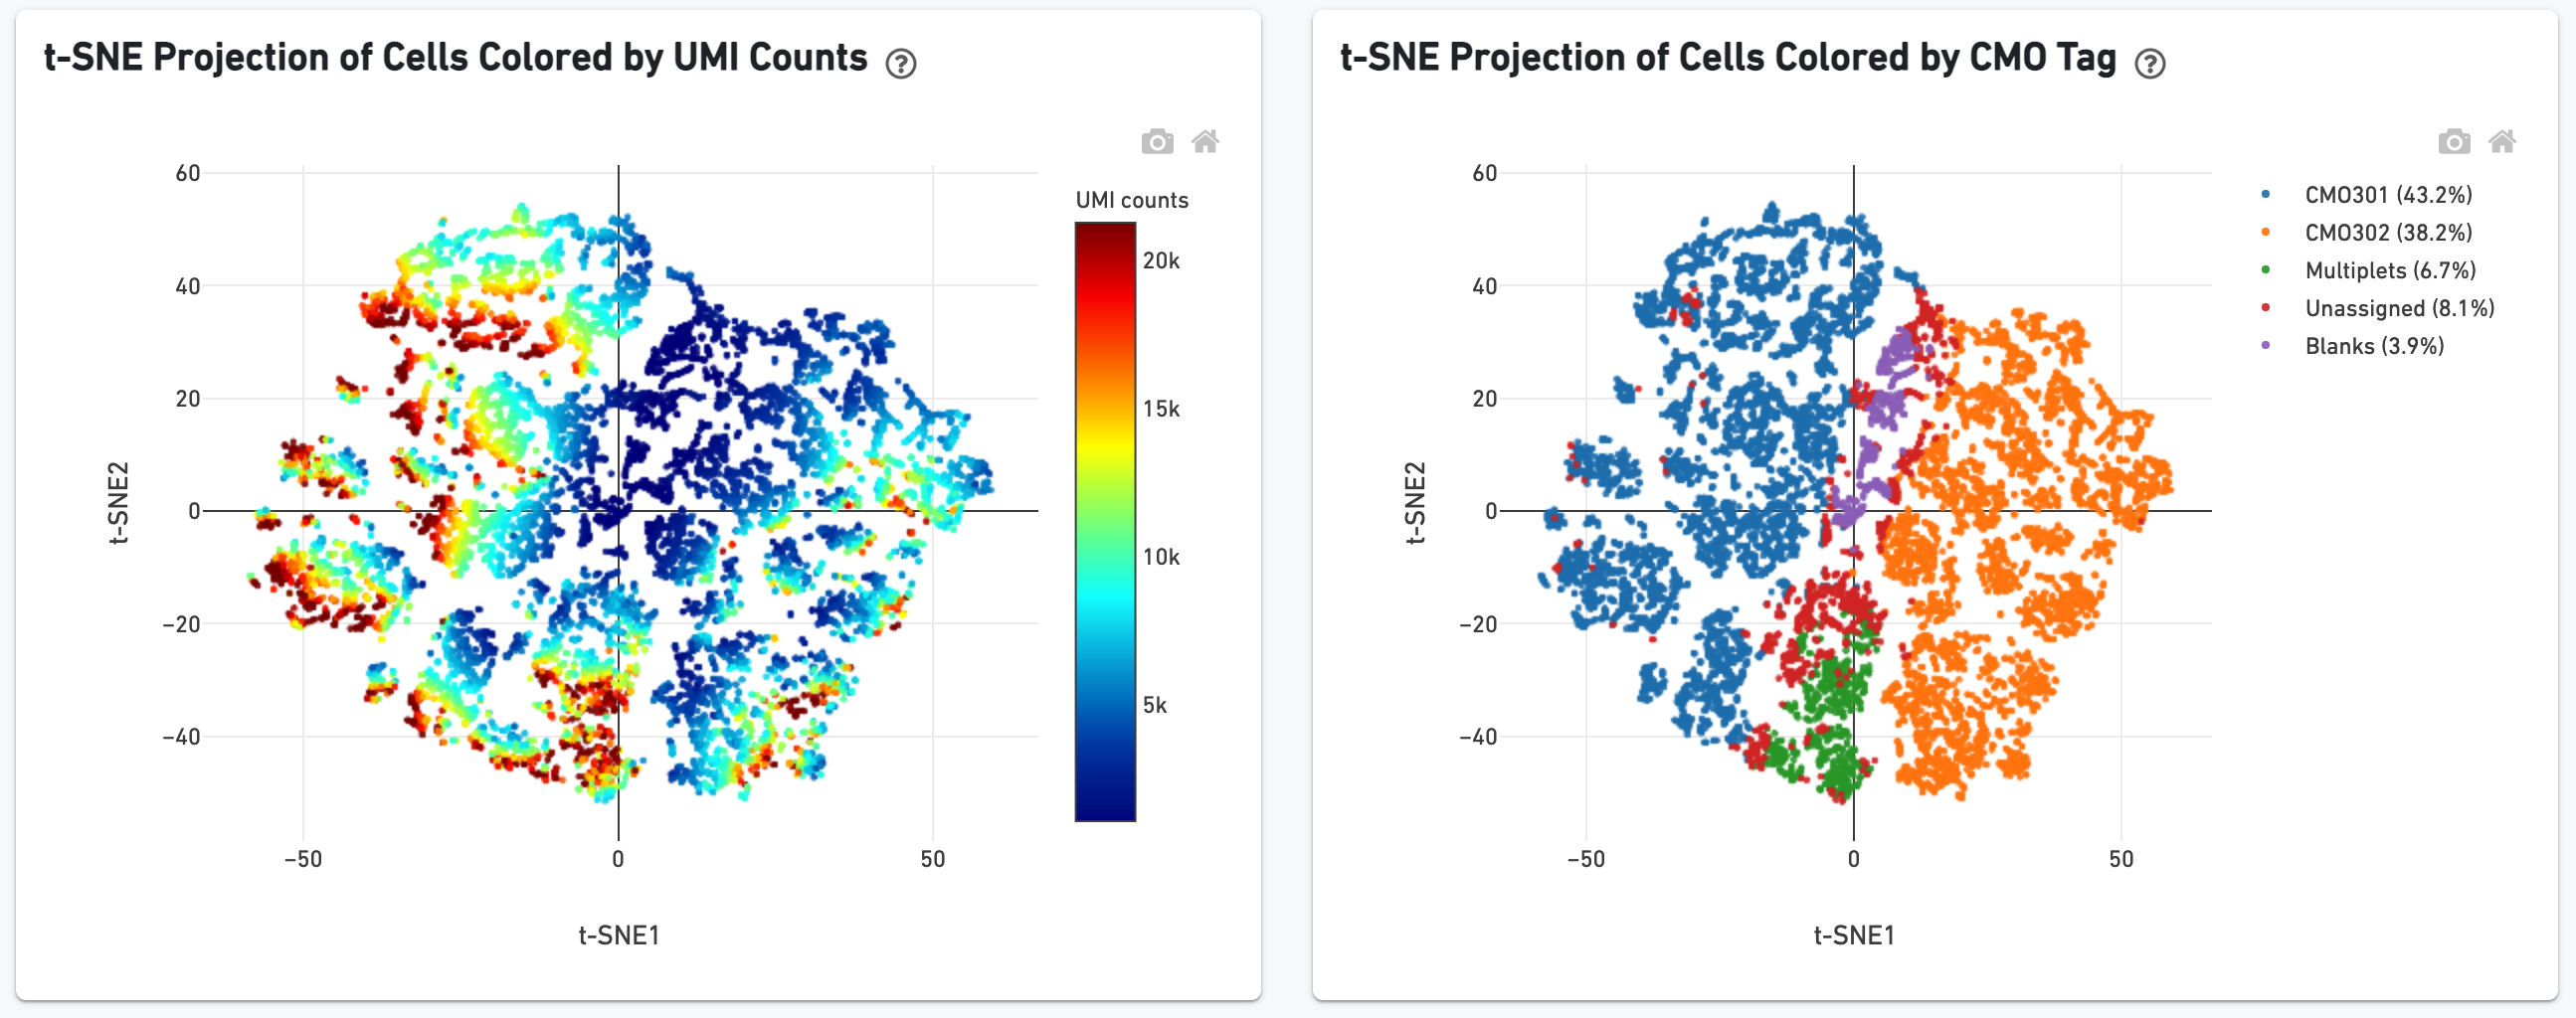
We show a t-SNE projection of just CMO counts, first colored by CMO UMI counts and then by CMO tag assignment. Ideally one would see clear separation between CMO tags.
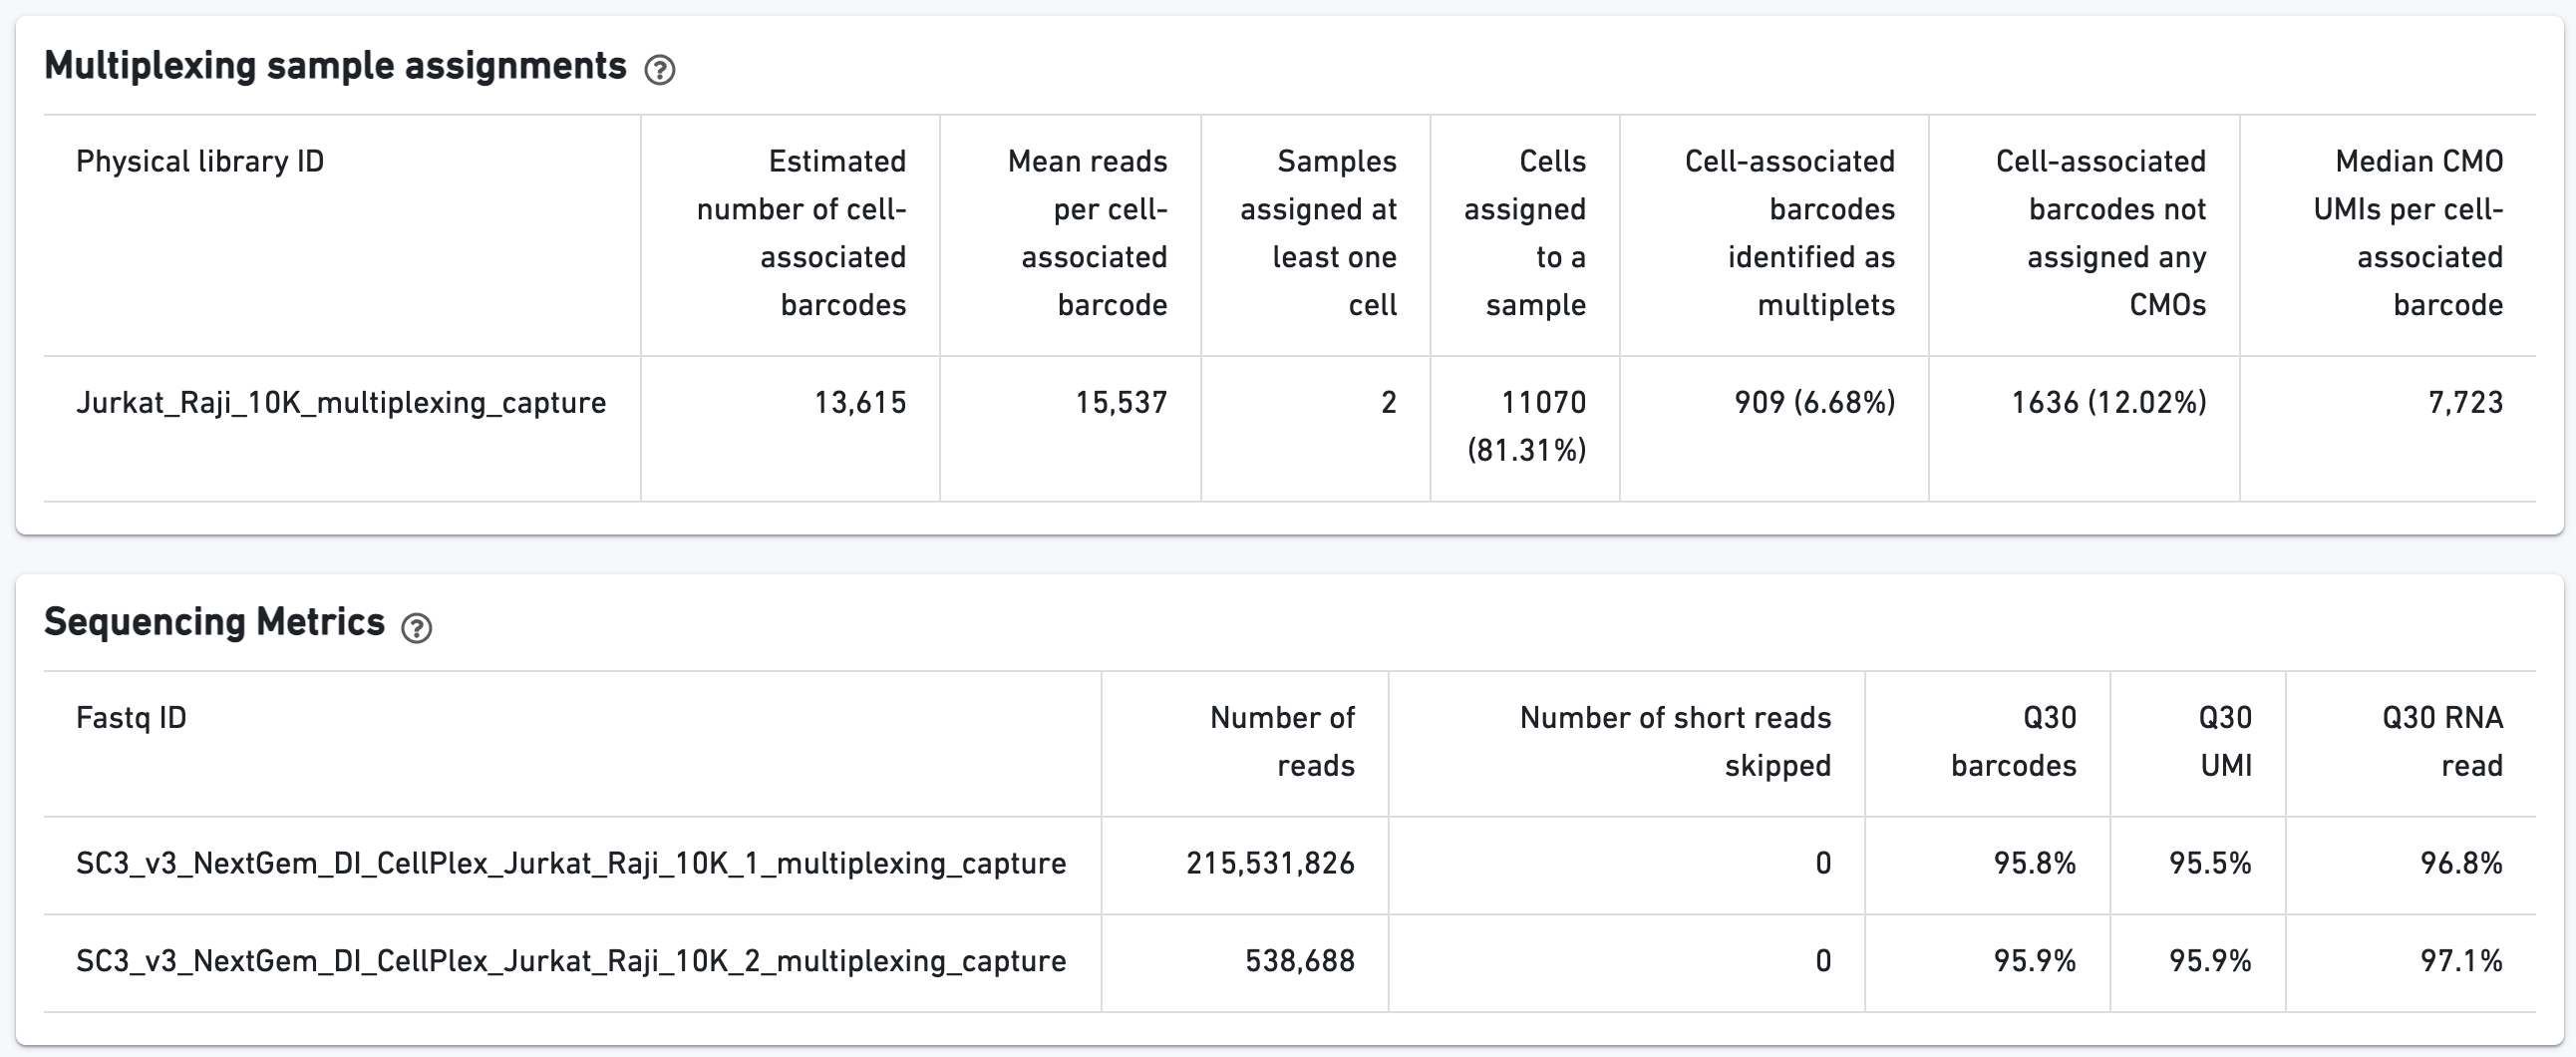
Additional tables are provided to show Multiplexing sample assignments, Sequencing Metrics, Metrics Per Physical Library, and Metrics per CMO:
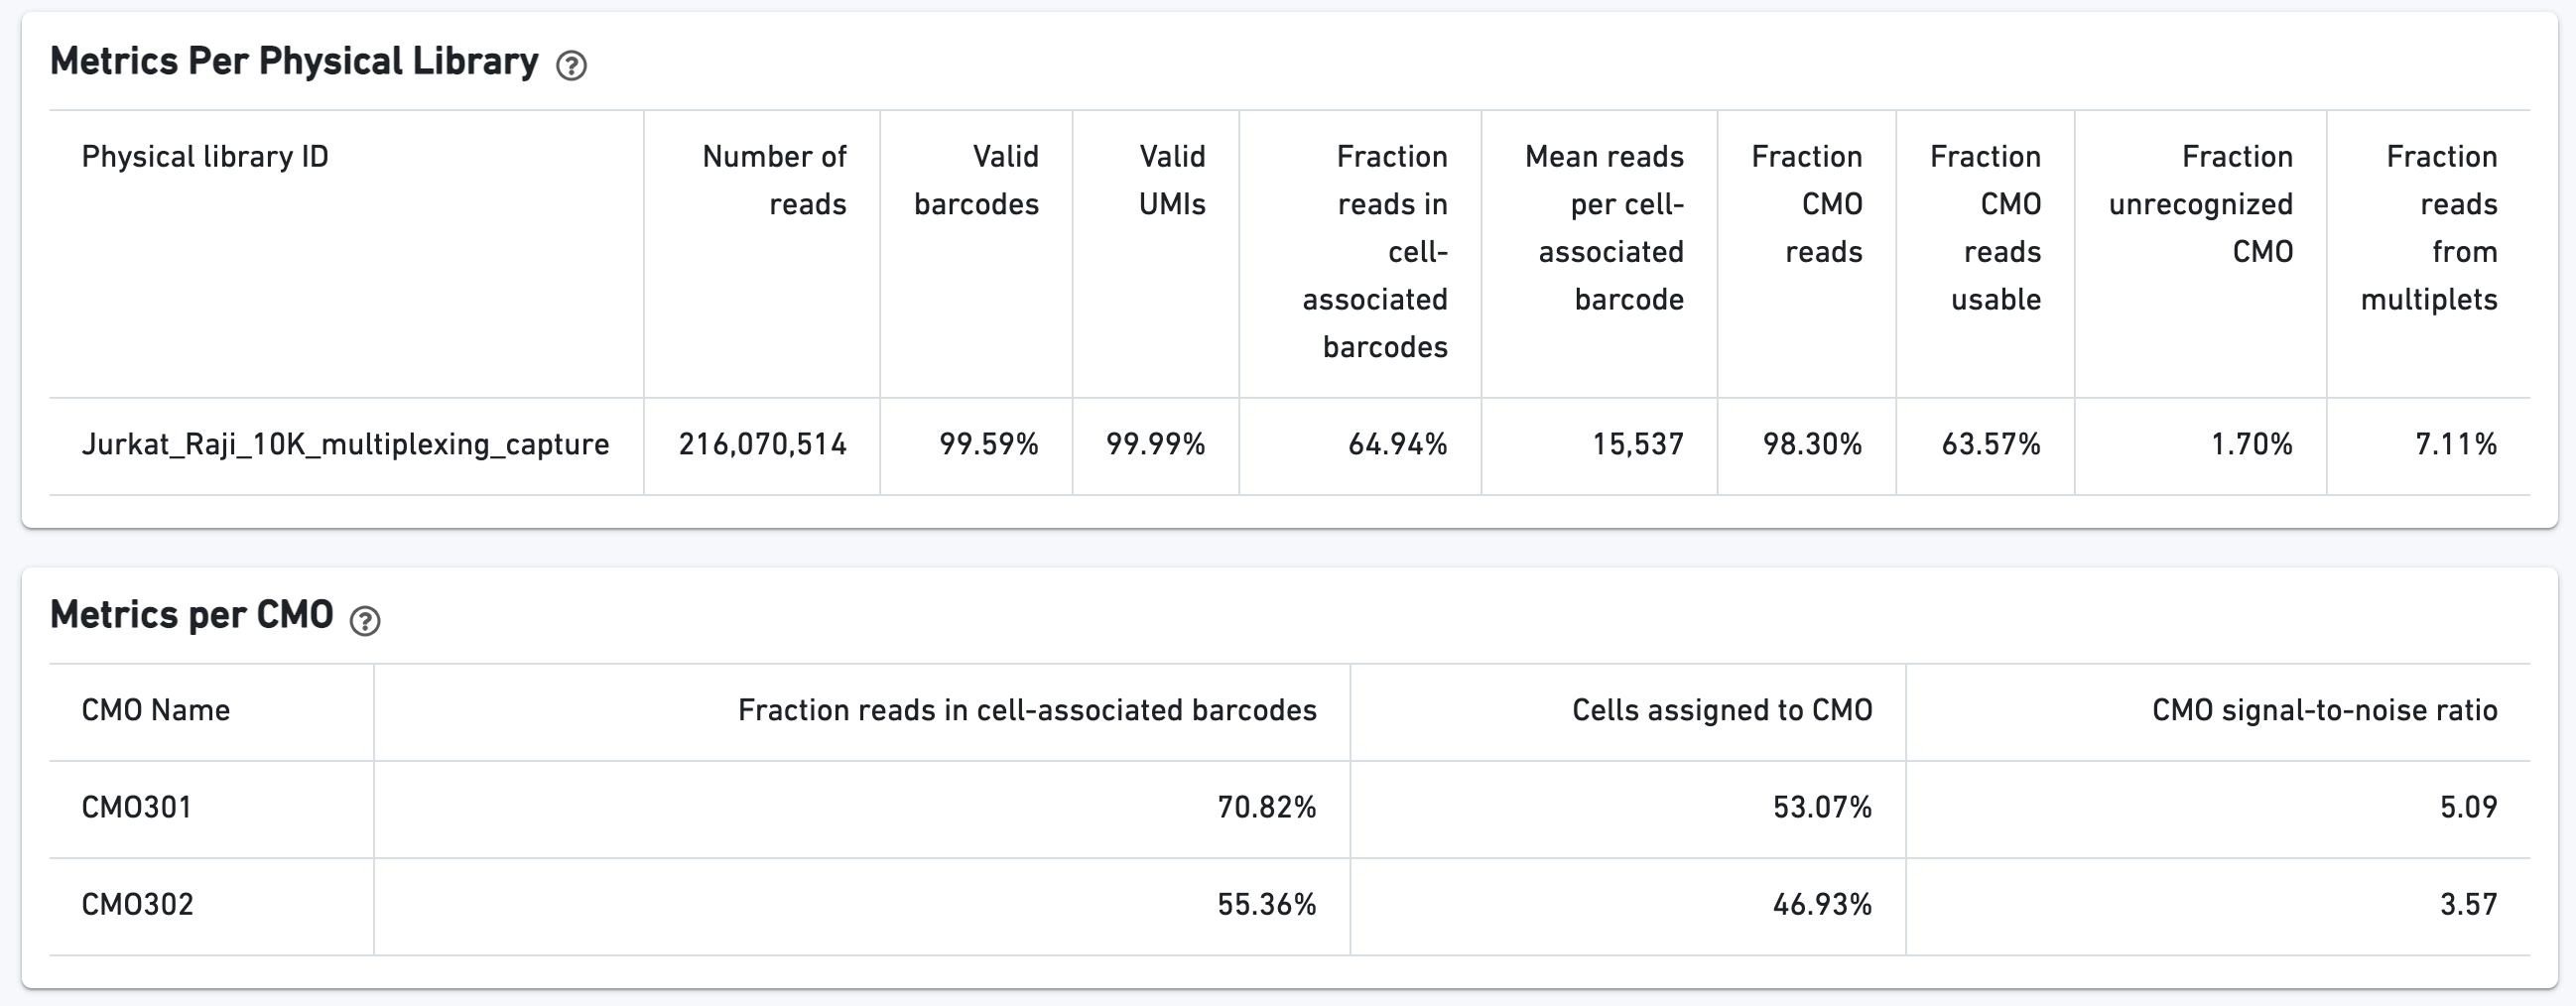
The CMO Barcode Rank Plot enables one to assess the quality of the CMO library. A steep drop-off between cells and background is expected for high quality libraries:
![]()
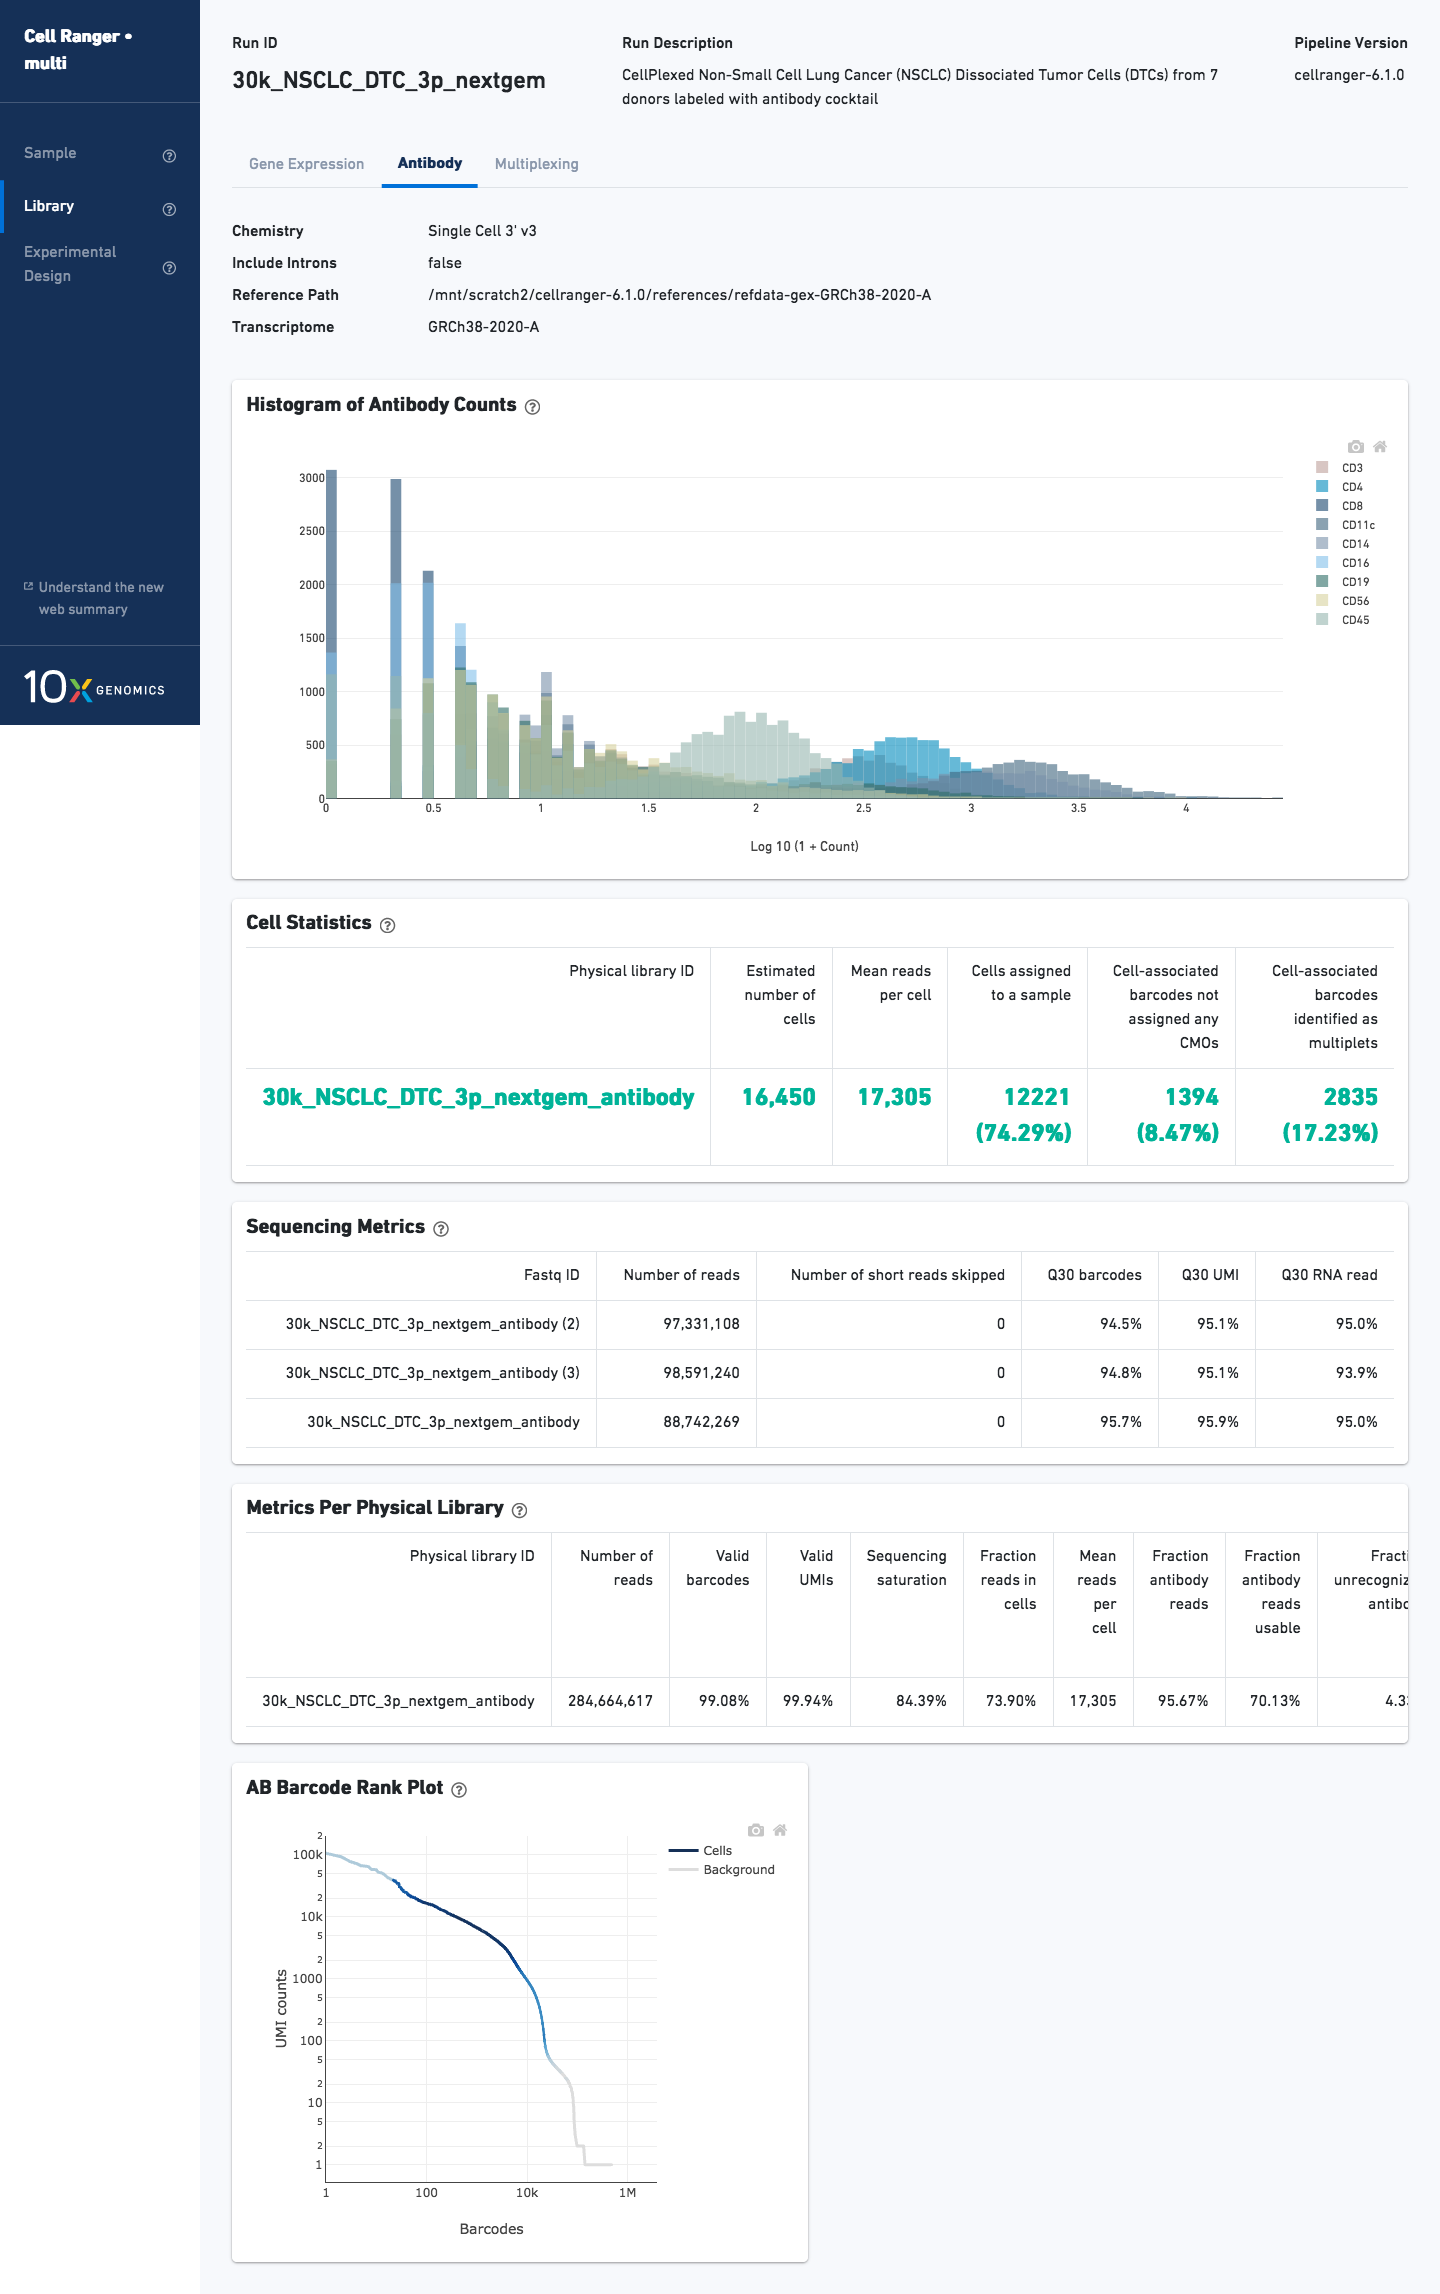
For analysis with Feature Barcode libraries, the Sample and Library views will have an additional tab. For example, the tab is called Antibody for an Antibody Capture library:
Do you have questions or feedback about this documentation? Please contact [email protected].